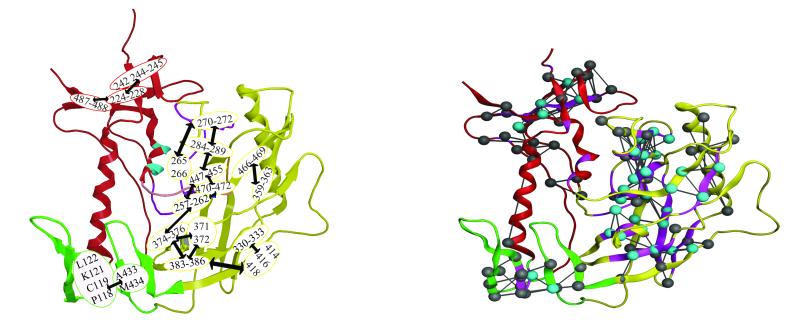
Figure 6. Consistency between GNM and MD calculated communication propensities.
A) Communication hubs in gp120 core envelope, as determined by GNM Ribbon diagram of the gp120 protein, highlighting the residues identified as communication hubs in gpo1, gpo2 and gpo3. The hubs, determined by network of pairs of residues with communication propensity less than 0.2 are labeled and encircled. The arrows between encircled residues indicate hubs that communicate readily. B) Residues pairs with efficient communication propensities as calculated from the gpo3 17ns MD trajectory, are drawn as gray and cyan balls and connected with a line. Residues pairs demonstrating low communication propensity in both GNM and MD calculations are colored cyan. Residues exhibiting low communication propensity determined by GNM are drawn as purple ribbon.

