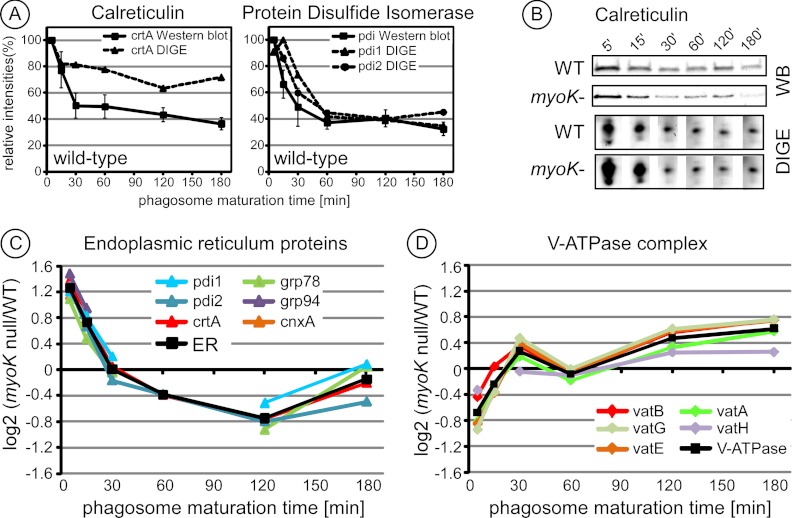
Fig. 4.
The ratio profiles of ER components and V-ATPase subunits are inversely correlated when comparing phagosomes from myoK null and wild type cells. A, Curves from both quantitative immunoblotting and 2D-DIGE intensity profiling of calreticulin (crtA) and protein disulfide isomerase (pdi) isoforms in phagosomes from wild-type cells were highly similar, with a maximum early in maturation (5′/0). For immunoblot and 2D-DIGE, the peak intensity value of the profile was set to 100% and the rest of the curve was normalized accordingly. In immunoblots, curves are based on triplicates and error bars represent ± S.E. 2D-DIGE profiles represent duplicates. B, Immunoblot profiles and 2D-DIGE spot images of the maturation sequence of calreticulin in phagosomes from wild-type and myoK null cells. C, D, myoK null/wild-type ratio profiles in log2 scale of normalized spot intensities of identified ER proteins (C) and of subunits of the v-ATPase complex (D). The profiles of all ER proteins and V-ATPase subunits identified in myoK-null phagosomes are shown here. The profiles were so similar that an averaged profile of the corresponding functional groups was computed and drawn in black. Only gene names (www.dictybase.org) are indicated in the legend. ER proteins: crtA, calreticulin A; cnxA, calnexin A; grp78 and grp94, glucose regulated protein of 78 kDa and 94 kDa; pdi1 and 2, protein disulfide isomerase isoform 1 and 2; soluble v-ATPase complex subunits vatA, B, E, G, H.

