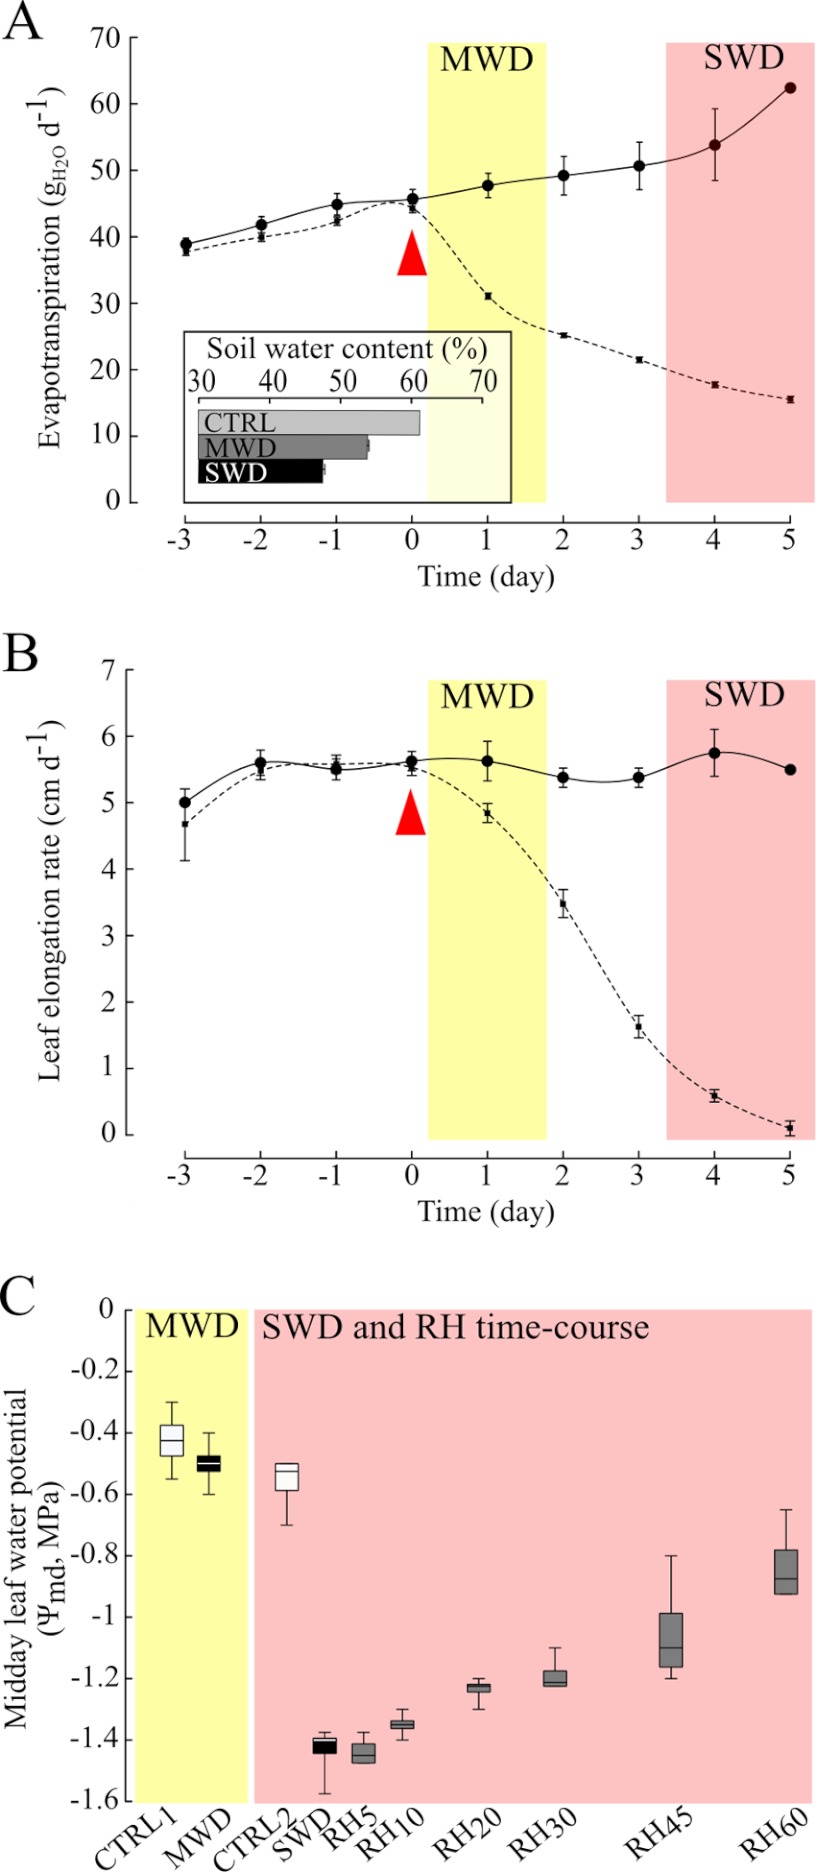
Fig. 1.
Evapotranspiration, leaf growth, and plant water status characterization. A, the evapotranspiration (gH2O/d) is shown for control (black line, n = 8) and stressed (broken line, n = 32) plants. Mean values ± S.E. are shown. The red arrow indicates the beginning of water shortage in stressed plants. The inset shows the soil water content assessed in control (CTRL, n = 8), mild water deficit (MWD, n = 4), and severe water deficit (SWD, n = 28) treatments. B, the elongation rate of the fifth leaf (cm/d) is depicted for control (black line, n = 8) and stressed (broken line, n = 32) plants. Mean values ± S.E. are shown. C, the midday leaf water potential of plants (Ψmd, MPa) was measured concomitantly to the samplings of the leaf growing zone. Each box represents the quartile below (Q1) and above (Q3) the median value. Vertical bars show minimum and maximum values. Box plots are shown for mild water deficit (MWD), severe water deficit (SWD), and for the rehydration time course (RH5 to RH60), in comparison to control plants (CTRL1 and CTRL2) at the same ontogenic development.

