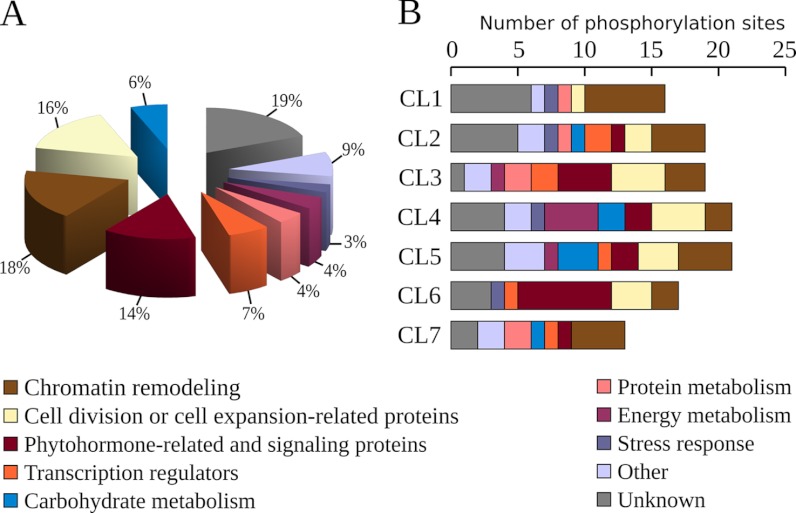
Fig. 4.
Functional cataloging of proteins displaying changing phosphorylation status in the growing zone of maize leaves upon contrasting water regimes. A, proteins were functionally categorized using the UNIPROT database, the DBGET system or from information retrieved from already published works. B, the number of phosphorylation sites associated with the seven main SOTA clusters are shown according to their functional classification. The cluster identifications (CL1, CL2, CL3, CL4, CL5, CL6, and CL7) refer to Fig. 5 and Table I.

