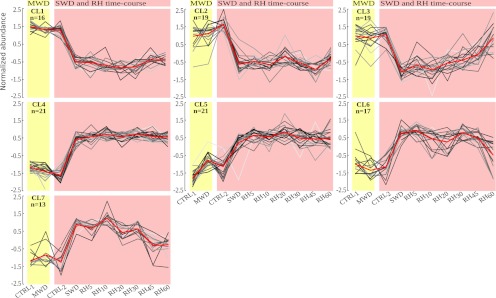
Fig. 5.
Self organizing tree algorithm (SOTA clustering) of the phosphorylation sites significantly affected by plant water status. The seven main clusters are shown (the four additional clusters are displayed in supplemental Fig. S3). Individual profiles are depicted by gray lines (Z score) for mild water deficit (MWD), severe water deficit (SWD), and for the rehydration time course (RH5 to RH60), in comparison to control plants (CTRL1 and CTRL2) at the similar ontogenic development (for a detailed view of individual profiles, see supplemental Fig. S6). The average profile is marked in red. The cluster identification and the number of profiles included in each cluster are indicated in the left upper corner.

