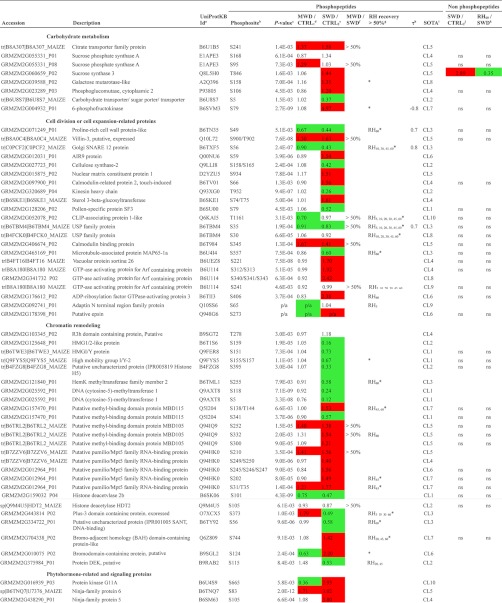
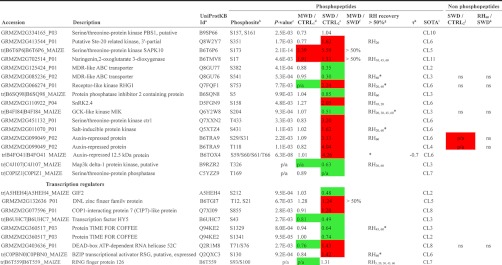
Table I. Partial list of phosphorylation sites significantly affected by changing plant water statuses.
a Refers to UniProtKB Identifier retrieved from sequence similarity searches using the UniProt BLAST tool (http://www.uniprot.org/).
b Multiple sites of phosphorylation are separated by a coma while ambiguous sites are separated by /. All phosphorylation sites reported here were confirmed by manual inspection of the raw data to verify the phosphorylation site assignment obtained using X! Tandem.
c Refers to the p values obtained from the one-way ANOVA, “p/a” refers to qualitative changes.
d Refers to the fold change computed between the light to heavy ratio measured during MWD and the light to heavy ratio measured during CTRL1. Decreasing trends in phosphopeptide abundance are highlighted in green while increasing trends in phosphopeptide abundance are highlighted in red.
e Refers to the fold change computed between the light to heavy ratio measured during SWD and the light to heavy ratio measured during CTRL2. Decreasing trends in phosphopeptide abundance are highlighted in green whereas increasing trends in phosphopeptide abundance are highlighted in red.
f “> 50%” indicates that the ratio between quantitative changes relative to control plants detected on mild water deficit (MWD) and those detected on sever water deficit (SWD) reached more than 0.5.
g Refers to time points of the rehydration kinetics which displayed a >50% recovery compared to the variation of phosphopeptide abundances detected during SWD. “*” indicates when the linear regression of phosphopeptide abundances vs. duration of the rewatering events, was significant (p value < 0.05).
h Kendall τ coefficient refers to the correlation between relative abundance of phosphorylation site and midday leaf water potential. Only significant Kendall τ coefficients are showed (p value < 0.02). Plots are shown in supplemental Fig. S3.
i Refers to the cluster number shown in Fig. 5 and in supplemental Fig. S2.
j Refers to the fold change computed between the light to heavy ratio measured during SWD and the light to heavy ratio measured during CTRL2 at the protein level. Information is provided for each reliably quantified protein, “ns” indicates that no significant change was detected. SWD-induced decreases in protein abundance are highlighted in green while SWD-induced increases in protein abundance are highlighted in red.
k Refers to the fold change computed between the light to heavy ratio measured during RH60 and the light to heavy ratio measured during SWD at the protein level. Information is provided for each reliably quantified protein, “ns” indicates that no significant change was detected. RH60-induced decreases in protein abundance are highlighted in green while RH60-induced increases in protein abundance are highlighted in red.


