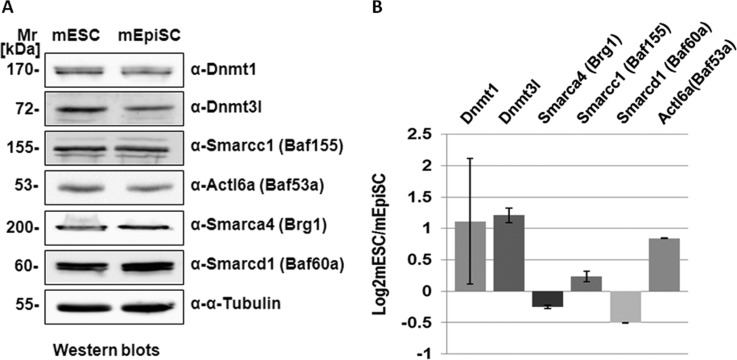
Fig. 5.
Immunoblot analyses of proteins with significantly different mESC/mEpiSC expression. A, Immunoblot analyses of selected DNA methyltransferase and Swi/Snf-related Baf complex components. Nuclear protein extracts (20 μg) from mESC and mEpiSC were loaded on 1D SDS-PAGE gel and transferred to membrane followed by immunoblotting using native antibodies. Mr refers to standard protein marker and α-tubulin was used as a loading control. B, Immunoblot quantification of two replicates of each protein verified. Bands for same protein in two replicated immunoblots were measured for intensity and the mean log ratio of mESC/mEpiSC fold change (the height of column) and the standard deviation (the error bar) between two blots were plotted.

