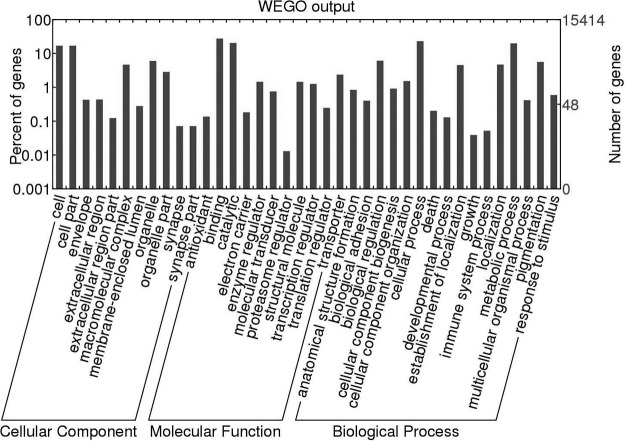
Fig. 1.
Gene ontology. Bar graph displaying the gene ontology terms (according to the categories “cellular component,” “molecular function,” and “biological process”) assigned to peptides inferred from transcriptomic data for Fascioloides magna and plotted using the WEGO tool (43).

