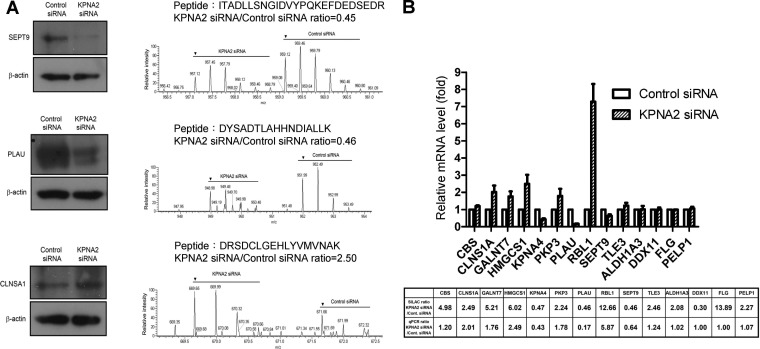
Fig. 2.
Validation of KPNA2-regulated proteins. A, CL1-5 cells were transfected with control and KPNA2 siRNA, respectively. After transfection for 48 h, cell lysates were prepared (20 μg per lane) and detected using Western blotting. The MS spectra, peptide sequences, and quantified ratios (arrow indicates the first peak of the spectrum) of SET9, PLAU and CLNSA1 are presented. B, The relative mRNA levels of differentially expressed proteins in KPNA2 knockdown cells. Total RNA from control siRNA or KPNA2 siRNA-transfected cells was purified and reverse-transcribed, and the resultant cDNA subjected to qPCR analysis using gene-specific primers. Fold change of the mRNA level for each protein in KPNA2 knockdown cells was calculated as a ratio relative to control siRNA-treated cells. Results were expressed as mean values ± S.D. from three independent experiments.

