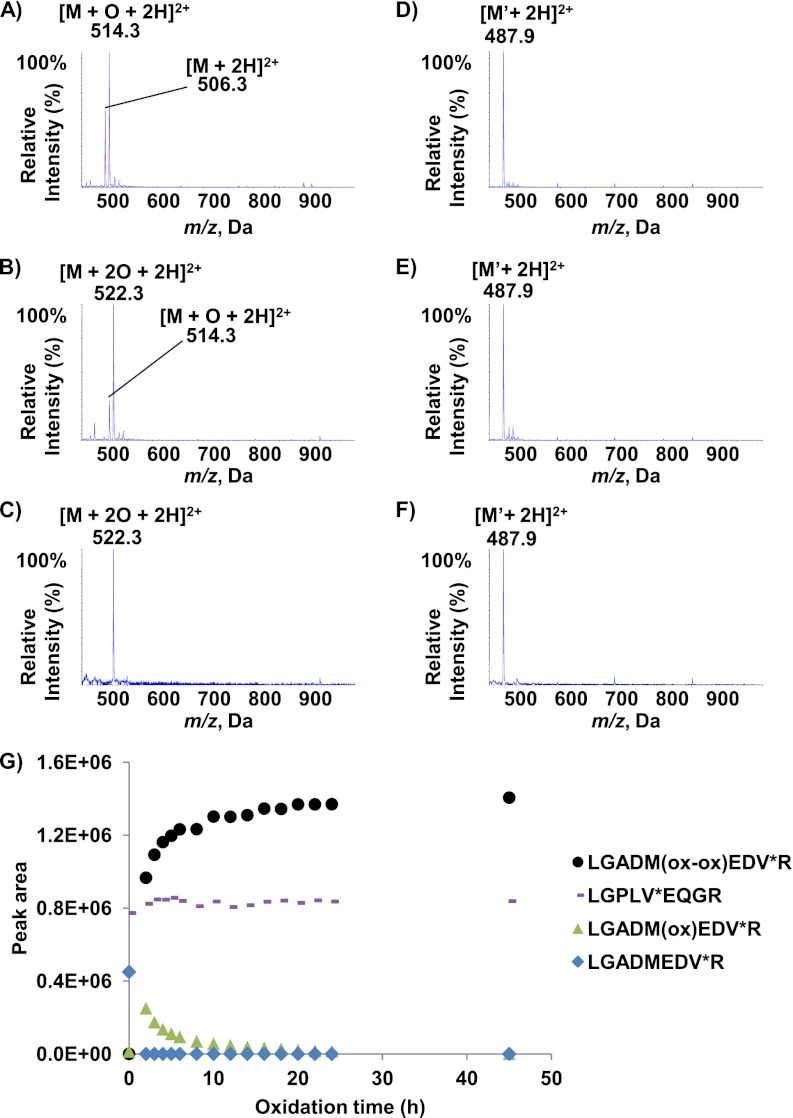
Fig. 2.
Full mass spectra of AQUA peptides LGADMEDV*R and LGPLV*EQGR after oxidization in water and Oxidization kinetics in plasma. Mass spectra of synthetic LGADMEDV*R peptide in water containing 0.5% formic acid (A), after oxidization with hydrogen peroxide (B) and after oxidization with performic acid and phenol (C). Mass spectra of synthetic LGPLV*EQGR peptide in water containing 0.5% formic acid (D), hydrogen peroxide (E) or performic acid and phenol (F). G, shows the change over time in the LGADMEDV*R (blue), LGADM(ox)EDV*R (green), LGADM(ox-ox)EDV*R (black) and LGPLV*EQGR (pink) peak areas during oxidization with a performic acid/phenol mixture in digested plasma.

