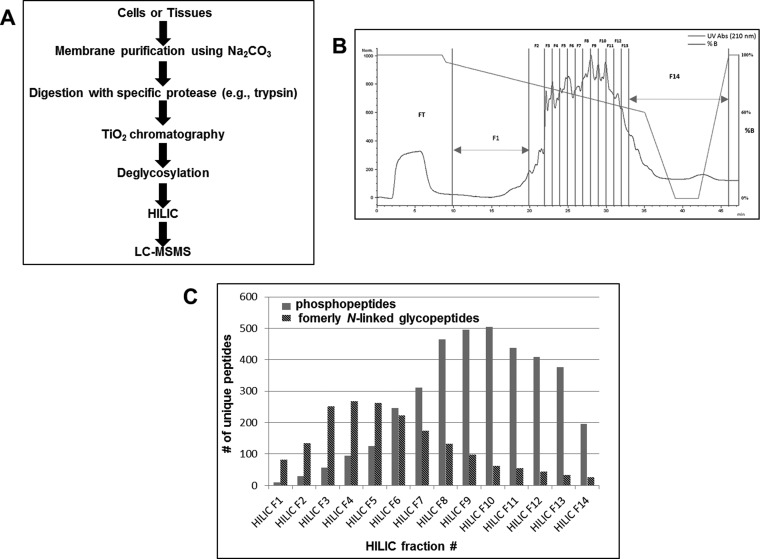
Fig. 1.
A, Illustration of the strategy for simultaneous isolation and analysis of phosphorylated peptides and formerly N-linked sialylated glycopeptides using TiO2 in combination with micro-HILIC separation and LC-MS/MS. B, HILIC chromatogram showing the UV trace of eluting phosphopeptides and formerly N-linked sialylated glycopeptides. The fractions selected for LC-MS/MS analysis are illustrated by F1-F14. The red line illustrates the elution gradient. C, The number of unique phosphopeptides (blue) and formerly N-linked sialylated glycopeptides (red) identified in each of the fractions from the HILIC separation shown in B.

