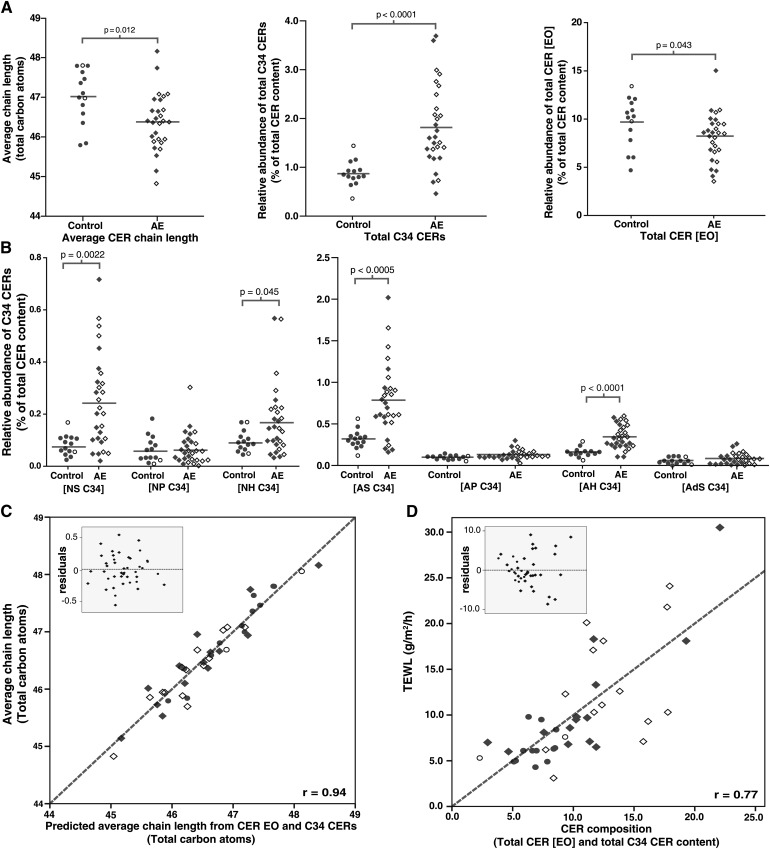
Fig. 5.
CER composition in control subjects and AE patients. (A) Dot plot showing the average chain length of all CERs in total; the relative abundance of total C34 CERs, and the relative abundance of total [EO] CERs. (B) Dot plots indicating the relative abundance of C34 CER species for each subclass. (C) Scatter plot of univariate analysis of the predicted average chain length (by the abundance of C34 CERs and [EO] CERs) versus the observed average chain length. Gray dotted line represents the optimal fit (r = 0.94): Average chain length = (0.33 × C34 CERs) + (0.24 × CER[EO]). (D) Scatter plot of univariate analysis of C34 CER and CER [EO] versus the TEWL. Insets show the residuals of the respective plots. Gray dotted line represents the optimal fit (r = 0.77): TEWL = 8.2 + (4.6 × C34 CERs) − (0.6 × CER[EO]). Control subjects are indicated by open and filled circles. AE patients with are indicated by open and filled diamonds. Data points indicate carriers and noncarriers of FLG mutations, respectively.

