Fig. 3.
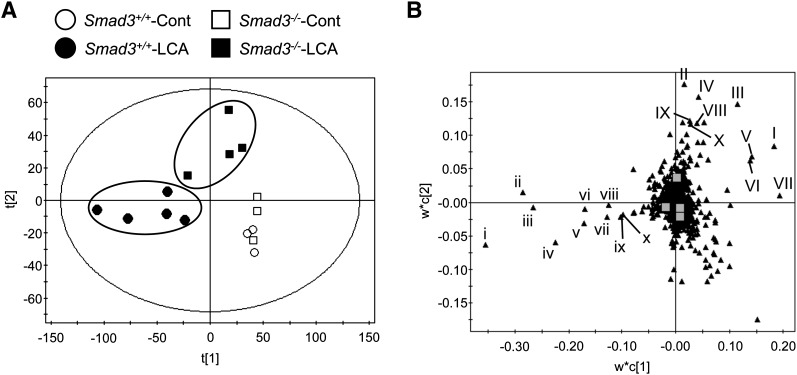
Difference in LCA-altered serum metabolites between wild-type and Smad3-null mice. (A) PLS of the serum metabolome among wild-type with control diet (Smad3+/+-Cont, open circle); wild-type with LCA diet (Smad3+/+-LCA, filled circle); Smad3-null with control diet (Smad3−/−-Cont, open square); and Smad3-null mice (Smad3−/−-LCA, filled square). (B) Loading plot of the PLS. Lowercase and uppercase Roman numerals represent enhanced and attenuated ions in the wild-type mice fed LCA diet, determined by the contribution analysis (compared with that of the Smad3-null mice fed LCA diet), respectively. Identified ions are listed in Tables 1 and 2.

