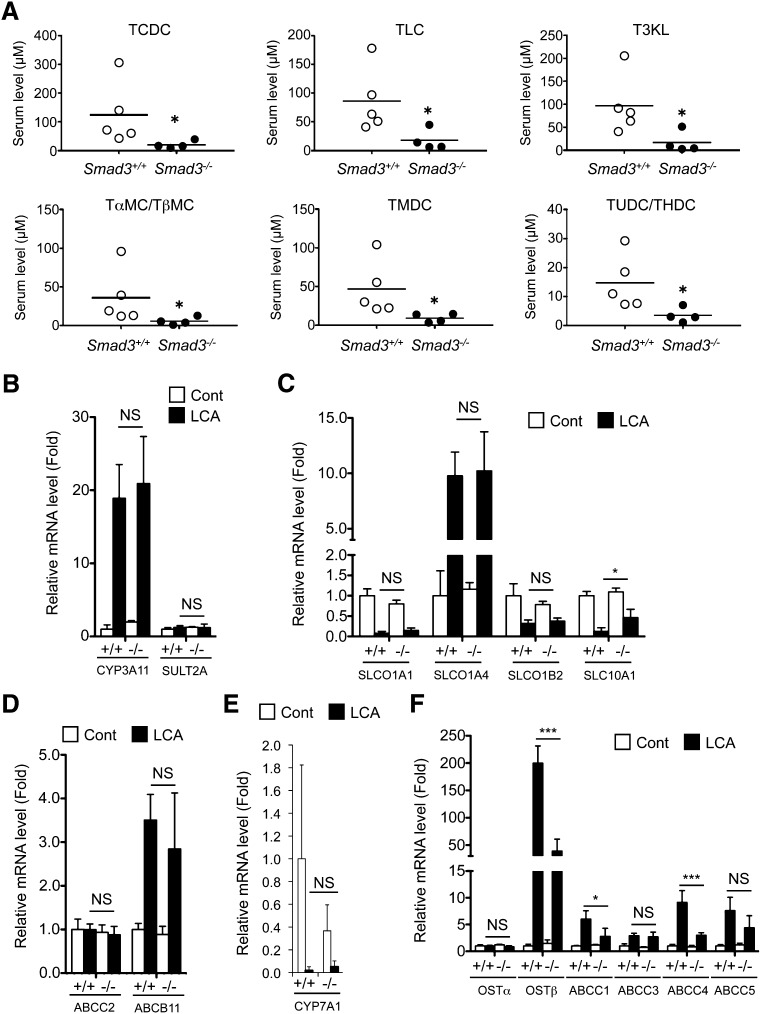
Fig. 4.
Difference in bile acid metabolism between wild-type and Smad3-null mice. (A) Quantification of serum BA levels after LCA exposure. (B–F) qPCR analysis of hepatic bile acid-related gene expression: bile acid metabolism (B), bile acid uptake (C), bile acid excretion to bile (D), bile acid synthesis (E), and bile acid export to vein (F). (A) Significance was determined by Mann-Whitney test (*P < 0.05) or (B–F) one way-ANOVA with Bonferroni's test (*P < 0.05; ***P < 0.001).

