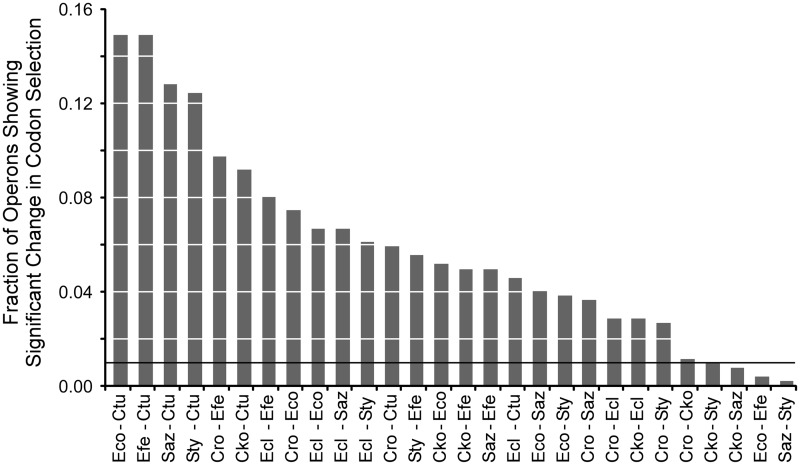
Fig. 5.
Excess of operons showing significant change in codon selection. The fraction of operons showing differences significant at P < 0.01 is plotted for pairwise comparisons among Escherichia coli, Escherichia fergusonii, Salmonella enterica Typhimurium, Salmonella enterica Arizonae, Citrobacter rodentium, Citrobacter koseri, Enterobacter cloacae, and Cronobacter turicensis. The horizontal line represents the expected fraction that will occur by change alone (1% of the operons). Values were scaled by polynomial regression.

