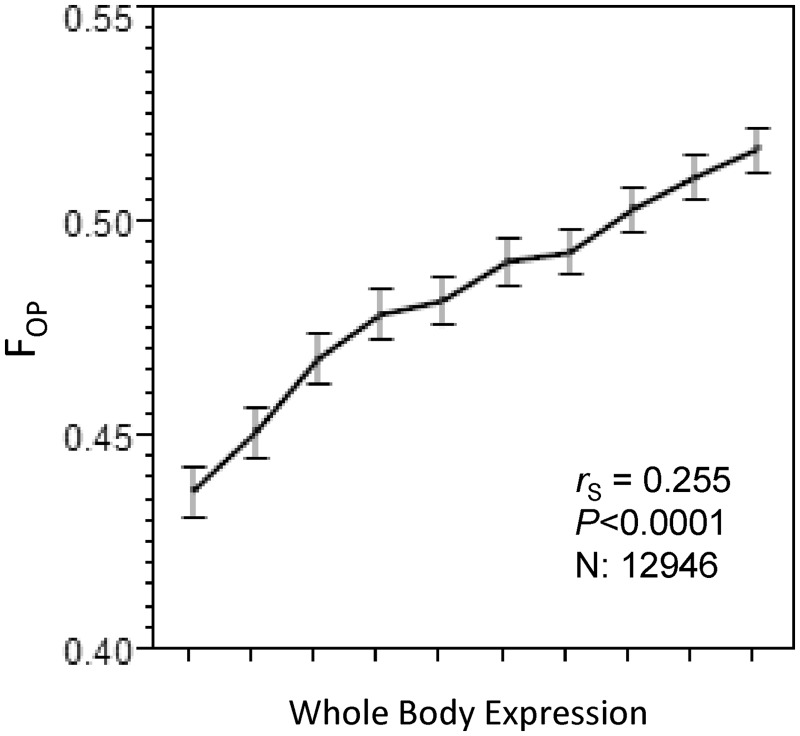
Fig. 1.
Relationship between the frequency of optimal codons (FOP) and gene expression levels. Genes are grouped into 10 bins of equal sizes (∼1,295 genes each) according to increasing levels of gene expression. Spearman’s correlation coefficient was calculated using all genes independently. Similar results are obtained using gene expression levels from reproductive tissues (see Discussion, Gene Expression and Synonymous Codon Usage).

