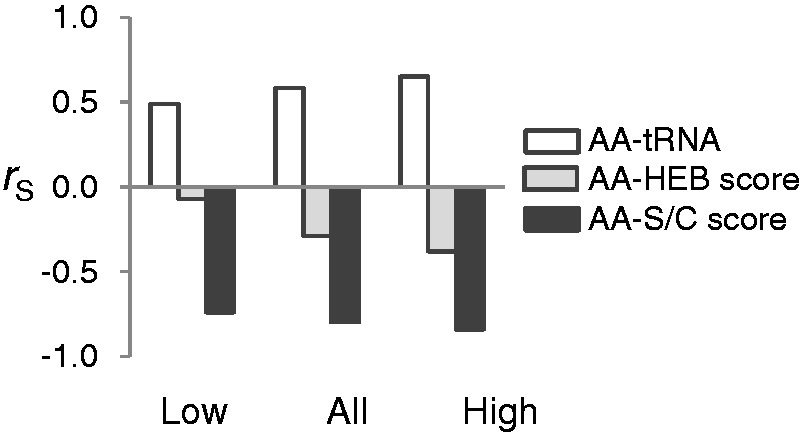
Fig. 2.

Spearman’s correlation between amino acid composition and tRNA gene copy number, HEB score, and S/C score for genes expressed at low levels (bottom 10% of genes; rS = 0.487, P = 0.029; rS = −0.073, P = 0.761 and rS = −0.740, P < 0.001, respectively), all genes (rS = 0.584, P = 0.007; rS = −0.289, P = 0.216 and rS = −0.797, P < 0.0001, respectively), and for genes expressed at high levels (top 10% of genes; rS = 0.652, P = 0.002; rS = −0.382, P = 0.097 and rS = −0.842, P < 0.0001, respectively).
