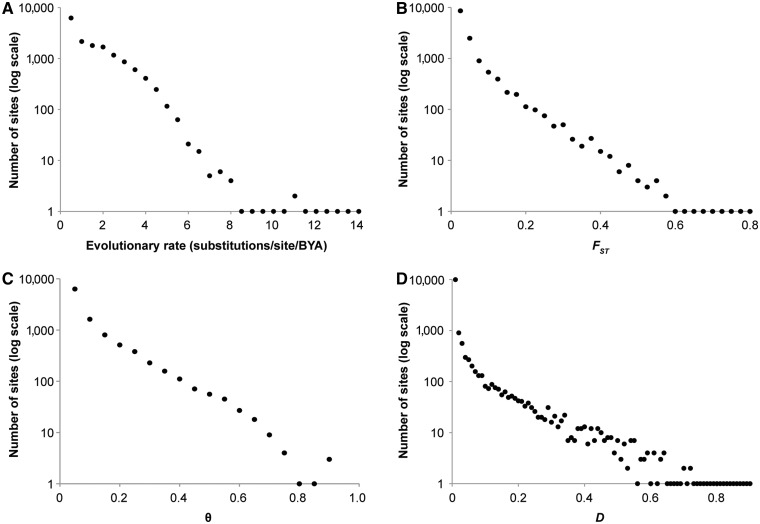
Fig. 1.
Distributions of evolutionary rates (A) harboring nonsynonymous SNPs (nSNPs) and the estimates of population differentiation: FST (B), θ (C), and Jost’s D (D). The numbers of positions containing nSNPs are plotted against the average parameter estimates in equally spaced bins of evolutionary rates (A) or population differentiation estimates (B–D). Evolutionary rates are in the units of substitutions per site per billion years.

