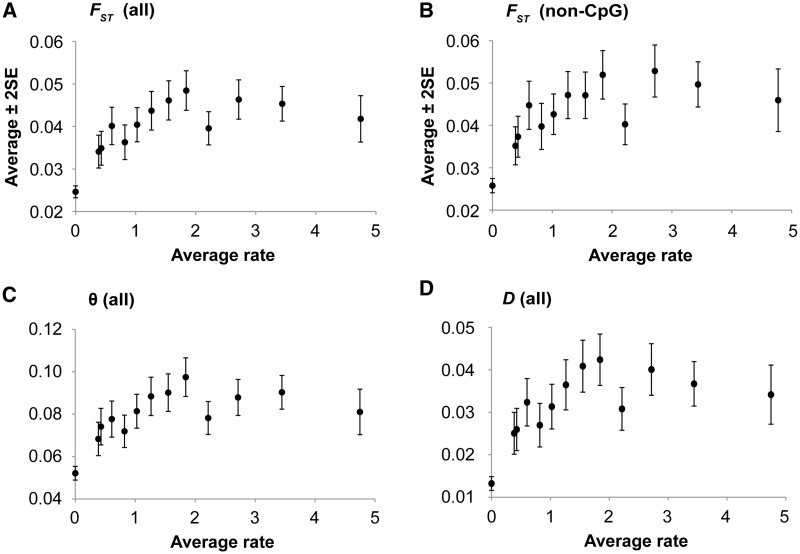
Fig. 2.
The relationship between evolutionary rates (r) and population differentiation estimates at nonsynonymous SNP (nSNP) sites. Each point shows average estimate of population differentiation for 1,000 nSNPs in nonoverlapping sliding windows with nSNPs sorted by r. All nSNPs occurring at positions with r = 0 were pooled together, so were the nSNPs with the highest r left in the last sliding window. (A, C, and D) show the relationships for all nSNPs, and (B) shows the relationship after excluding all the CpG positions. The patterns of θ and D at non-CpG sites are similar to those at all sites. The correlation coefficients of the underlying raw data (and sliding windows in A, C, and D) are 0.11 (0.59), 0.10 (0.54), and 0.10 (0.56) for FST, θ, and D, respectively. They are all significant at P < 10−15.

