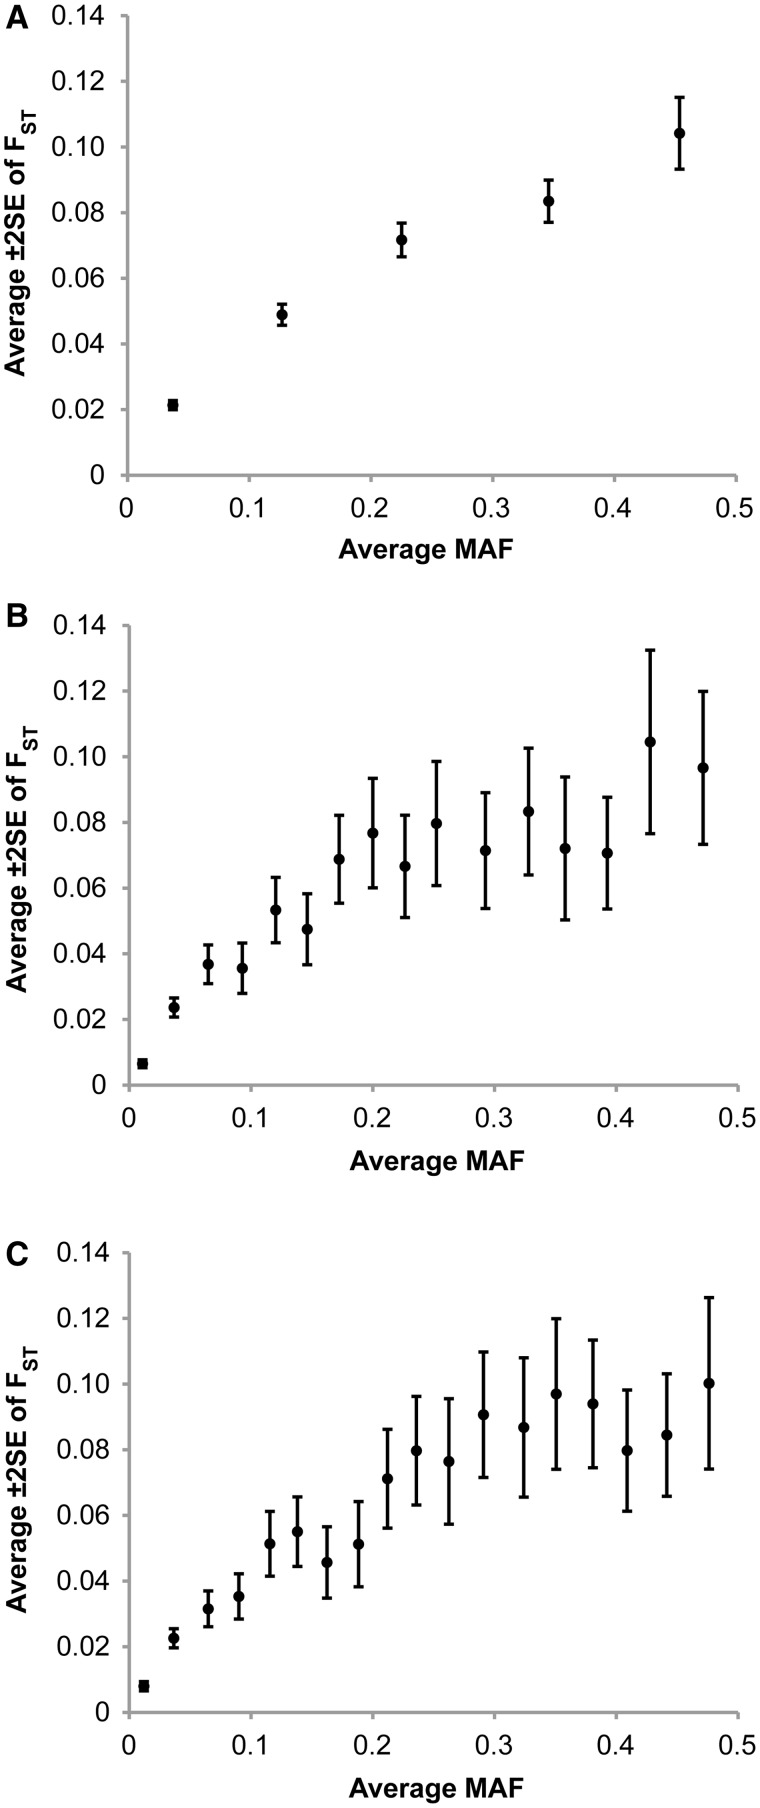
Fig. 4.
The relationship between minor allele frequency (MAF) and FST for nonexonic SNPs in the HapMap ENCODE regions. Each point shows the average FST (± two standard errors) in nonoverlapping sliding windows of SNPs sorted according to their MAF (1,000 SNPs per window in A and 100 in B and C). Panel (A) shows the relationship for all 4,729 nonexonic SNPs, and (B and C) show the relationship for 1,661 intronic and 1,840 intergenic SNPs, respectively.

