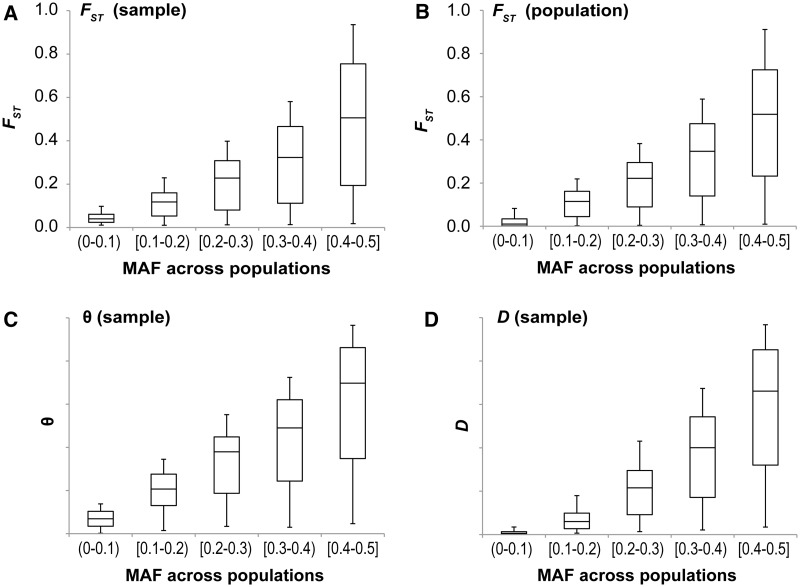
Fig. 5.
Results from computer-simulated data showing the relationship between minor allele frequency (MAF) and population differentiation measures calculated from sample allele frequencies (A, C, and D) and population allele frequencies (B). The first and third quartiles are shown as the lower and upper edges of each box, respectively. The median is shown as the horizontal line dividing the box. The whiskers stop at 5th and 95th percentiles. The parameter values used: N = 104, u = 5.10−6, m = 10−5, and t = 0. The correlation coefficients of the raw data (and sliding windows sorted by MAF of 10,000 sites) in (A–D) are 0.70 (0.98), 0.75 (0.99), 0.73 (1.00), and 0.79 (0.98), which are all significant at P < 10−15. Very similar distribution is obtained for the whole-population θ and D.

