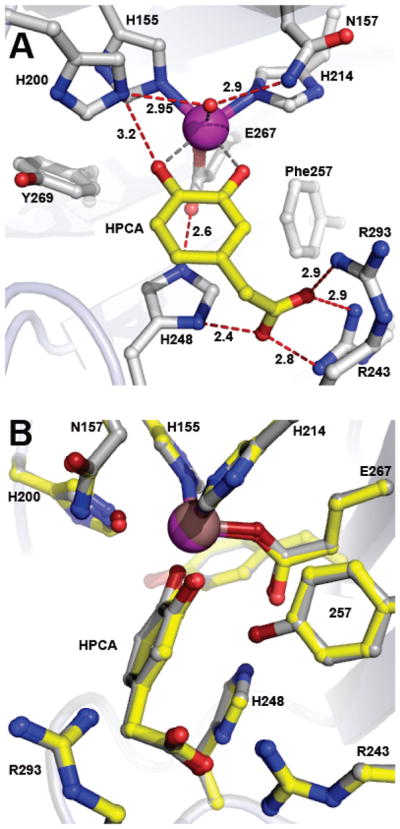
Figure 3.

Structure of optimal substrate HPCA bound in the active site of the Y257F variant (PDB 4GHD). (A) Interactions between bound HPCA and residues in the active site (subunit C). Red dashed lines show hydrogen bonds (Å). Gray dashed lines indicate bonds or potential bonds to iron (Å). Additional distances are given in Table S3. Atom color code: gray, carbon (enzyme); yellow, carbon (HPCA); blue, nitrogen; red, oxygen; purple, iron (Y257F). (B) Comparison of active site environments in the FeHPCD-HPCA (PDB 4GHG) and Y257F-HPCA (PDB 4GHD) complexes. Atom color code: gray, carbon (FeHPCD); yellow, carbon (Y257F); blue, nitrogen; dark red, oxygen (FeHPCD); red, oxygen (Y257F); bronze, iron (FeHPCD); purple, iron (Y257F). Additional rotated view for structure overlay in panel B is shown in Figure S3A.
