
Figure 10.
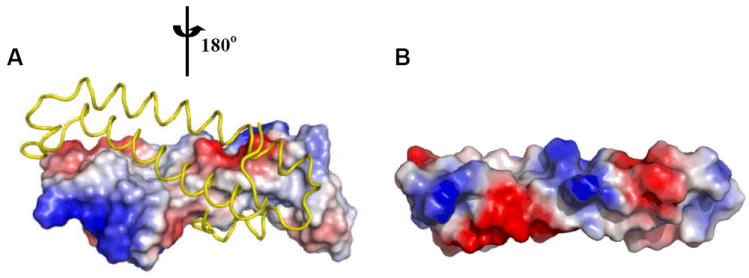
Surface potentials of TraMAt (PDB ID: 1RFY) and TraMNGR (PDB ID: 2Q0O) (from the anti-activation complex). For dimeric TraMAt, surface of one monomer is shown, the other monomer is shown as a Cα trace in yellow. Surface with positive potentials is colored in blue, and with negative potentials in red. TraMNGR is shown in the same view as the surface presentation of TraMAt monomer.