
Figure 7. Projections to the pFRG/RTN region surrounding the facial nucleus.
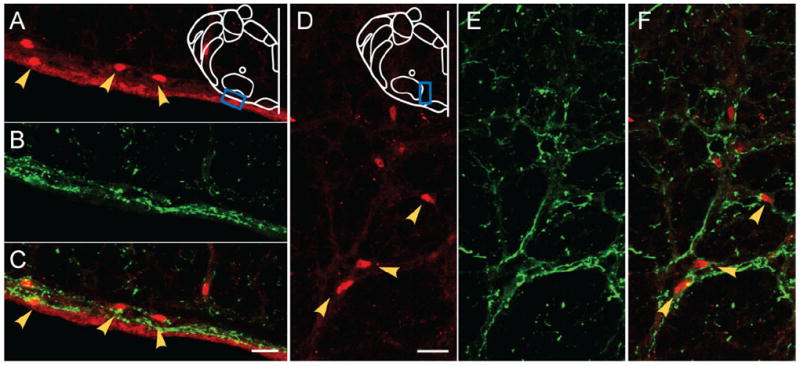
A,D: Phox2b-ir neurons (red) in ventral surface (A) and the region medial to the facial nucleus (D) in pFRG/RTN. B,E: EGFP-expressing processes (green) from unilateral injection into preBötC project to the ventral surface (B) and the region medial to facial nucleus (E) in pFRG/RTN. C,F: Superimposition of (A,B) and (D,E), respectively, showing some EGFP processes in juxtaposition to Phox2b-ir neurons in pFRG/RTN. Blue boxes in outlines represent areas where images were acquired. Yellow arrows indicate Phox2b-ir neurons. Magenta-green copy of this figure is available as Supporting Figure 6. Scale bars = 20 μm. [Color figure can be viewed in the online issue, which is available at www.interscience.wiley.com.]