Figure 1.
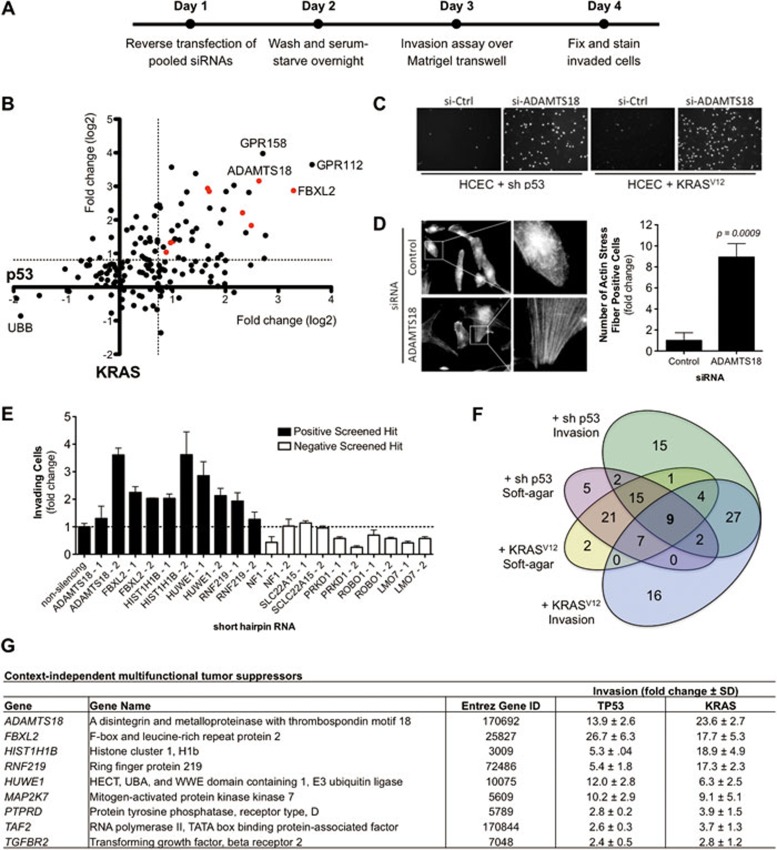
(A) Overall scheme of focused siRNA screen for tumor suppressors involved in regulating the invasive potential of normal cells. 1CTP (shRNA-TP53) and 1CTR (oncogenic-KRASV12) HCECs were reverse-transfected 48 h with pooled siRNAs prior to re-plating onto Matrigel-coated transwell filters. Invaded cells were Hoechst-stained and data were normalized to non-targeting siRNA control. (B) Scatterplot of the overall screening results. The x-axis represents fold changes in invasion in 1CTP cells, whereas the y-axis represents those for 1CTR cells. Each dot represents a single gene targeted by pooled siRNAs (four siRNAs/gene) and red dots represent multifunctional tumor suppressor genes (listed in G). The dotted line represents the statistical cutoff point and is defined as three standard deviations. (C) Representative images of Hoechst-stained invaded 1CTP and 1CTR cells with control siRNA or siRNA targeting the ADAMTS18 gene. (D) Depletion of ADAMTS18 using siRNAs induces the formation of F-actin stress fibers. (E) Screening results were partially validated in 1CTP cells using shRNA-mediated knockdown of five positive hits and five negative non-hits. Fold change in invasion is normalized to non-silencing shRNA. (F) Venn diagram of overlapping soft-agar growth and invasion suppressing genes in each cell background. Soft-agar hits were obtained from a previously published screen8. Nine genes were identified through comparative analysis of both screens. RNAi knockdown of these genes leads to multiple tumorigenic phenotypes. (G) List of the nine context-independent multifunctional tumor suppressor hits. Knockdown of these nine genes enhances both anchorage-independent growth and invasion in two independent backgrounds in vitro (also shown as red dots in B). Bar graphs are depicted as mean ± SEM.

