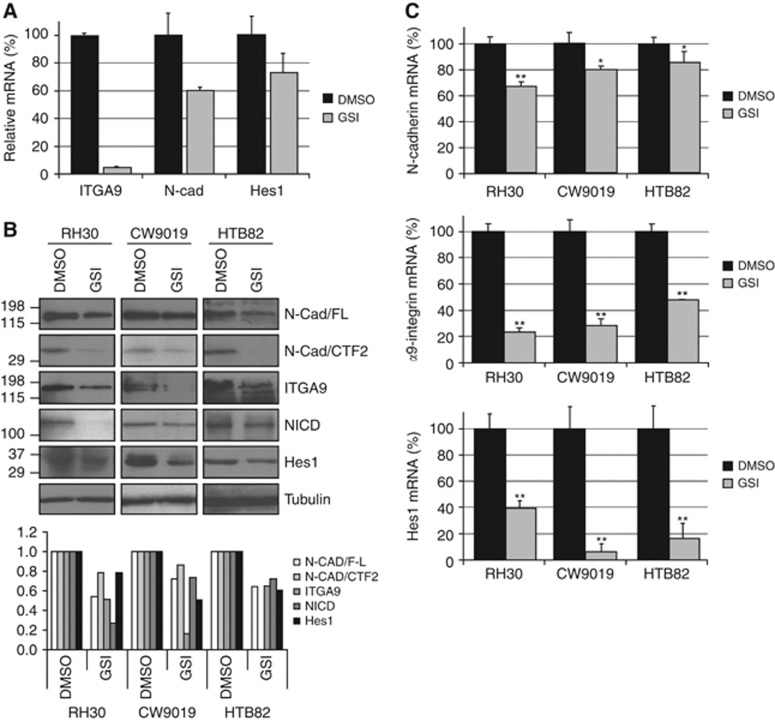
Figure 2.
Pharmacological inhibition of Notch signalling significantly reduced N-cadherin and α9-integrin expression. (A) Complementary DNA (cDNA) expression microarray showing the relative levels of α9-integrin (ITGA9), N-cadherin (N-Cad) and Hes1 expression in GSI-treated samples (GSI) compared with the control (DMSO). (B) Panel of western blots showing the effects of GSI on full-length N-cadherin (N-Cad/FL) and CTF2 fragment, α9-integrin (ITGA9), NICD and Hes1 levels compared with untreated samples (DMSO). Alpha-tubulin was used as a loading control. Below the western blot composition, a plot depicting densitometric analysis of each band of the western blot. (C) Relative mRNA levels evaluated by quantitative PCR in the presence (GSI) or absence (DMSO) of γ-secretase inhibitor. Neuronal cadherin, α9-integrin and Hes1 mRNA levels were evaluated in triplicate. Student’s t-test significance: *P<0.05, **P<0.005.

