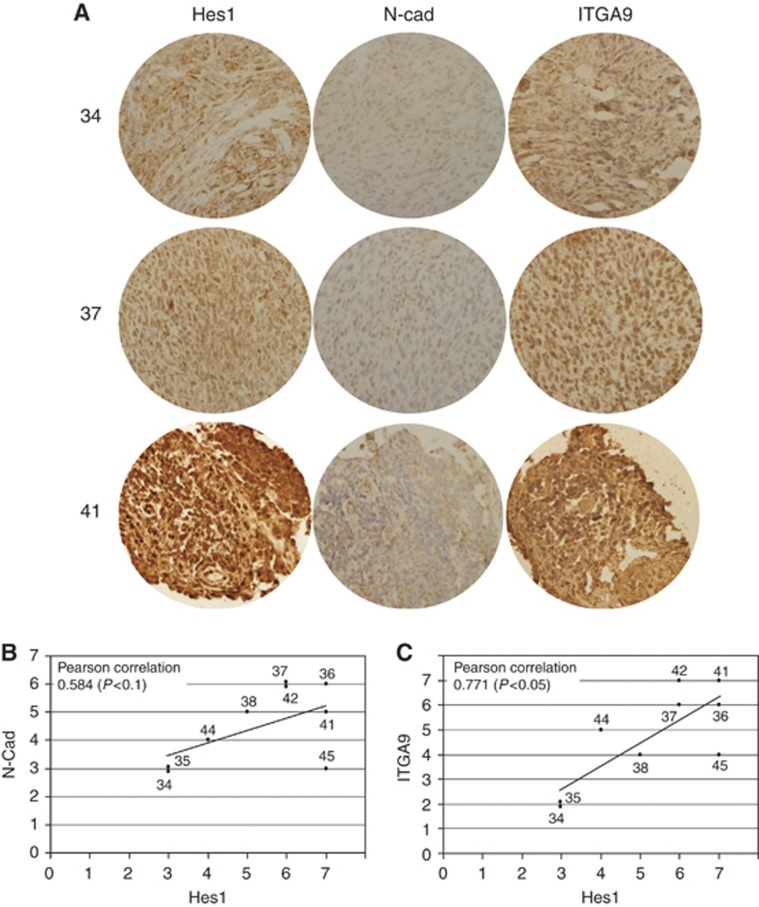
Figure 6.
The expression of Hes1, N-cadherin and α9-integrin correlate in archival RMS tumour samples. (A) Representative sections of three patients (34, 37 and 41) stained with anti-Hes1, N-Cad and α9-integrin antibodies. (B and C) Plots depicting the correlations between Hes1 and both N-cadherin and α9-integrin semiquantitative scores. Pearson correlation value and significance are shown in the upper left corner in each plot.

