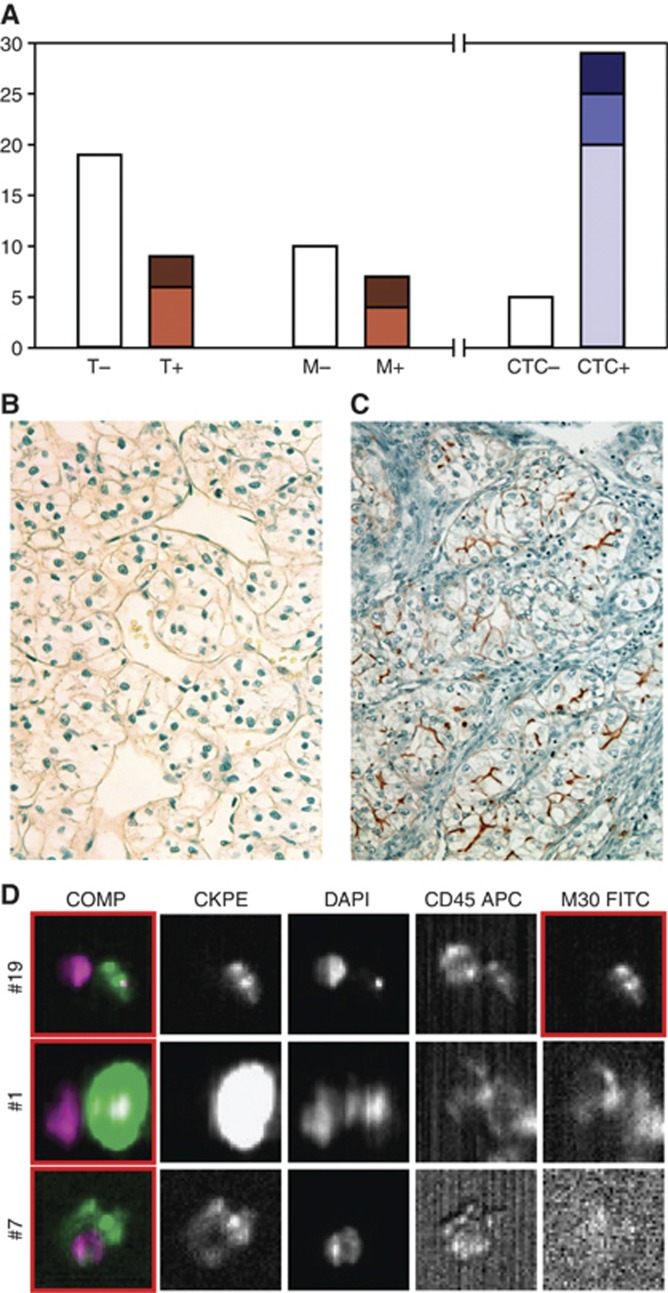
Figure 1.
EpCAM expression in mRCC primary tumours, metastasis and CTC. (A) EpCAM expression was analysed by IHC in primary tumours (T, n=28) and metastasis (M, n=17) obtained from 34 patients, for comparing IHC data with CTC results. The white bars represent the EpCAM-negative IHC in T (19 out of 28) and in M (10 out of 17) and patients that were CTC-negative by CellSearch assay (5 out of 34). The light brown bars represent weak staining in T (6 out of 9) and M (4 out of 7); the dark brown bars represent Moderate staining in T (3 out of 9) and M (3 out of 7). The light blue bar symbolises patients that had 1–4 CTC (20 out of 29), the dark blue bar symbolises patients that had 5–10 CTC (5 out of 29), the deep blue bar symbolises patients that had more than 10 CTC (4 out of 29). (B) The EpCAM staining profile is consistent in secondary lesions and synchronous CTC detection; one representative case of 4 is shown. The primary renal lesion (patient number 58) does not feature any EpCAM immunostaining (Original magnification 20X). (C) Characteristic EpCAM membranous immunoreaction appears in the tumour biopsy obtained from the surrenalic metastasis (patient number 58). (Original magnification × 20). (D) Analysis of three rare cells in baseline blood sample of patient number 58 using an Analyzer II device (Veridex, Raritan, NJ, USA). Horizontally, the photos show the same cell stained for the combination (Comp) of CK (green) and DAPI (violet); CK PE only; DAPI only; CD45 APC only; and M30 FITC only. The red squares indicate positively stained cells: events #1 and #7 are live CTC, exhibiting strong and irregular CK staining, respectively; in the photo #19 based on M30 staining profile (sufficient signal relative to background) the event on the right is classified as apoptotic CTC; the event on the left is a leukocyte (CD45-positive).

