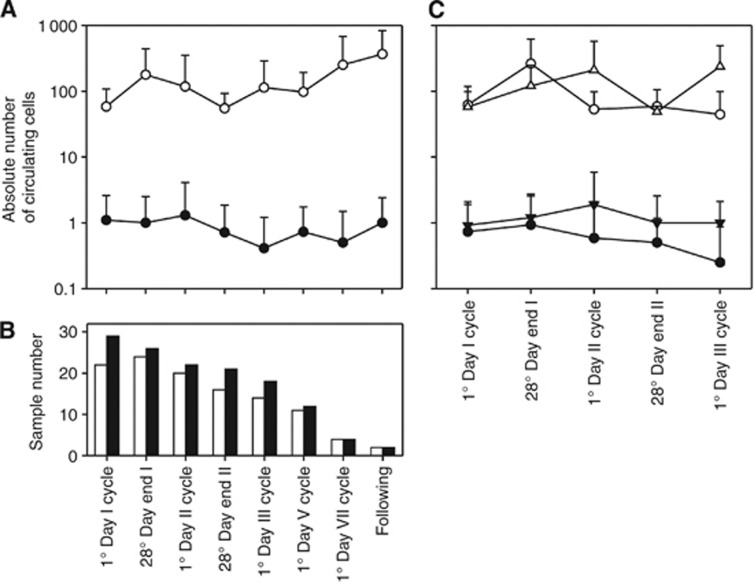
Figure 3.
CEC and CTC changes in mRCC patients under Sunitinib. (A) CEC and CTC values (mean +1 s.d., white and black symbols, respectively) synchronously determined in 30 mRCC patients receiving Sunitinib treatment are plotted in relation to time. (B) The bars represent the number of CEC and CTC samples (white and black symbols, respectively) collected at each time point. (C) CEC and CTC longitudinal graphs (white and black symbols, respectively) are separately plotted for non-progressed and progressed patients (○ and ∇ symbols, respectively). Time points with n ⩾14 were showed.

