Figure 5.
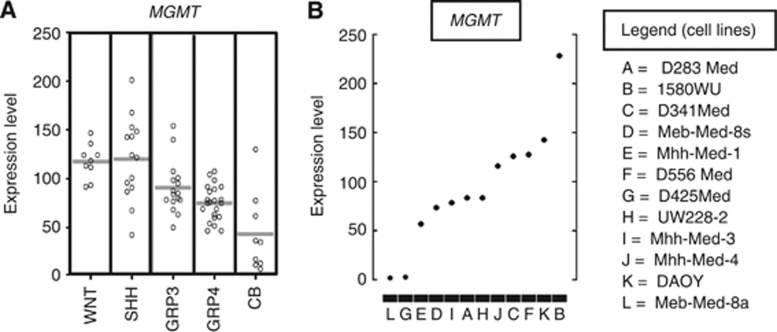
(A) The expression levels (Affymetrix HG U133 Plus 2.0 arrays) of MGMT in 61 medulloblastoma (Kool et al, 2012) grouped into the four molecular subtypes (Taylor et al, 2012) of medulloblastoma (WNT, SHH, Group 3 (GRP3), and Group 4 (GRP4)) compared with nine samples of normal cerebellum (CB), (B) MGMT expression levels of 12 medulloblastoma cell lines.

