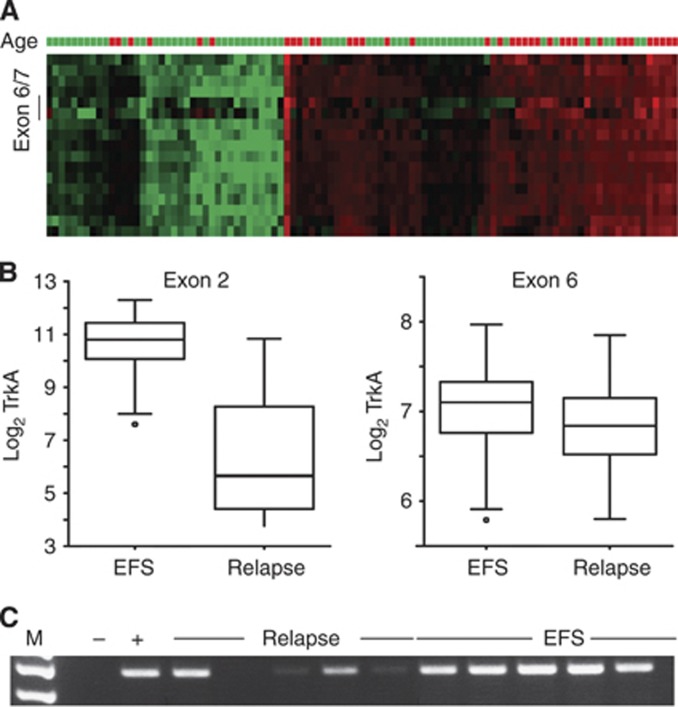
Figure 2.
Association of alternative exon usage in NTRK1 with outcome. (A) The heat map shows NTRK1 exon-level expression (rows, exon 1 on top) in our patient cohort. Exon 6/7 depicts the exons, for which the respective probes on the array are located. Red indicates exon upregulation and green indicates downregulation of an exon as compared with the median expression of the respective exon across all patients in our study. High NTRK1 expression was also correlated with young (<1 year) patient age. Age=patient age at diagnosis; green >1 year; red <1 year. (B) Differential association of NTRK1 exon expression with EFS or relapse. Left: NTRK1 exon 2 expression is high in EFS and low in patients with relapse (P=9 × 10⁻¹⁵). Right: correlation between NTRK1 exon 6 expression in NB patients with EFS is less pronounced although still significant (P=0.002). (C) Real-time PCR of NTRK1 exons 5–8 shows preferential expression in patients with EFS when compared with patients who experienced relapse (M=marker, − and + depict the negative and positive controls, respectively).

