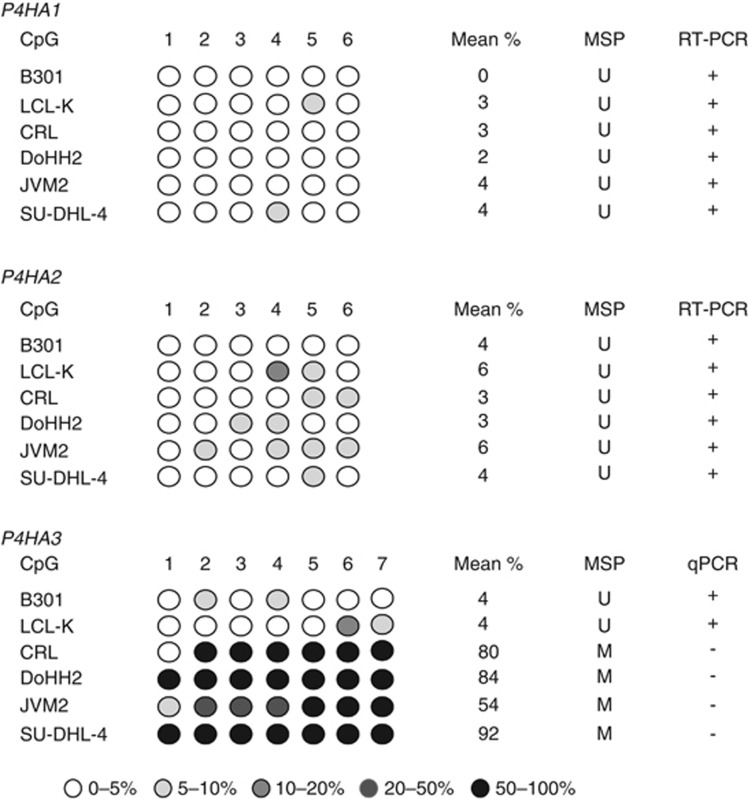
Figure 4.
Analysis of methylation in C-P4H gene CpG islands in NHL cell lines. The figure shows pyrosequencing analysis of the CpG islands of each P4H gene in NHL cells lines and LCL. The degree of methylation at each analysed CG dinucleotide is represented by the intensity of shading in the circles as indicated in the figure. Also shown in the mean % methylation of the analysed fragment and the result of expression analysis (RT–PCR or qPCR).

