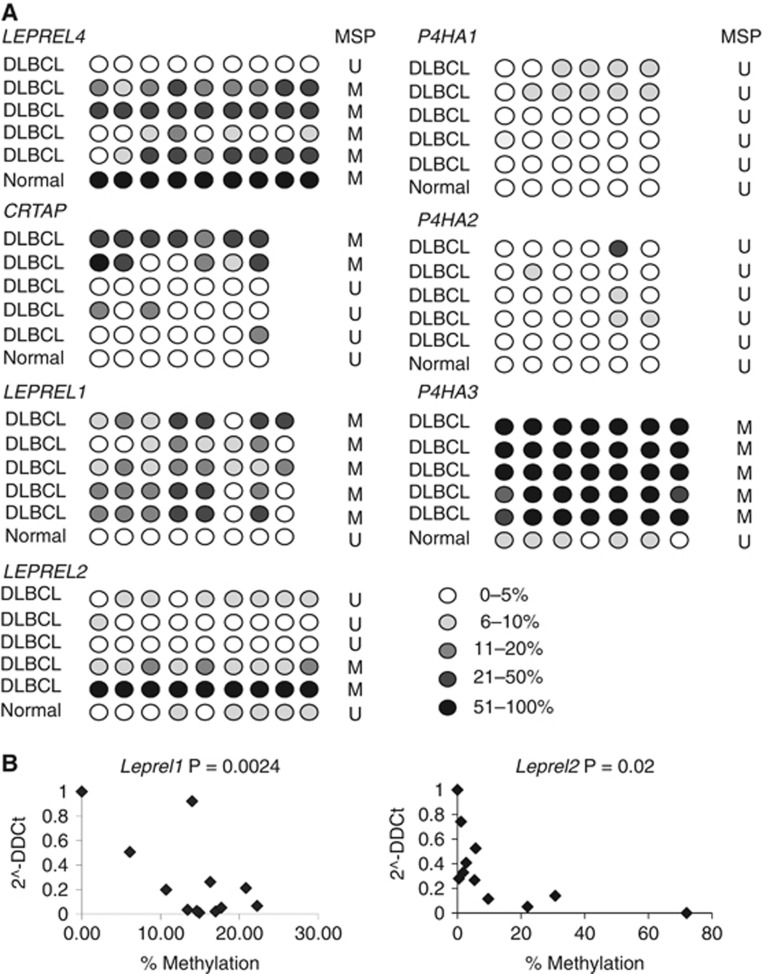
Figure 5.
Analysis of methylation in P3H and P4H genes in primary DLBCL. (A) Representative profiles of CpG island methylation for each C-P3H and C-P4H gene in clinical DLBCL cases. Pyrosequencing was performed as described in Materials and Methods. Five levels of methylation are represented, the level of methylation increasing with increasing intensity of shading in the circles as shown in the figure. The result of simultaneous MSP analysis is indicated. (B) CpG island methylation correlates with down-regulation of expression in clinical cases of DLBCL. Scatter plots are shown of mRNA vs mean % CG methylation for Leprel1 and Leprel2 in DLBCL.

