
Figure 1. Flow chart of study participants.
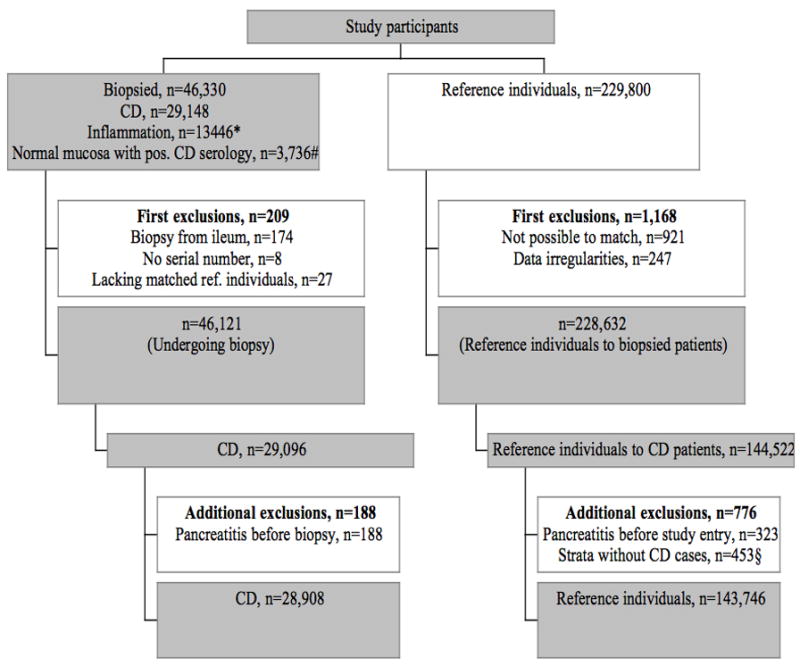
CD, Celiac disease
* Inflammation (intraepithelial lymphocytosis) equals Marsh 1–2
# Normal mucosa with positive IgA/IgG endomysium, transglutaminase or gliadin antibodies.
§ Because all calculations were performed stratum-wise, reference individuals whose index individual with celiac disease had been excluded were also excluded.