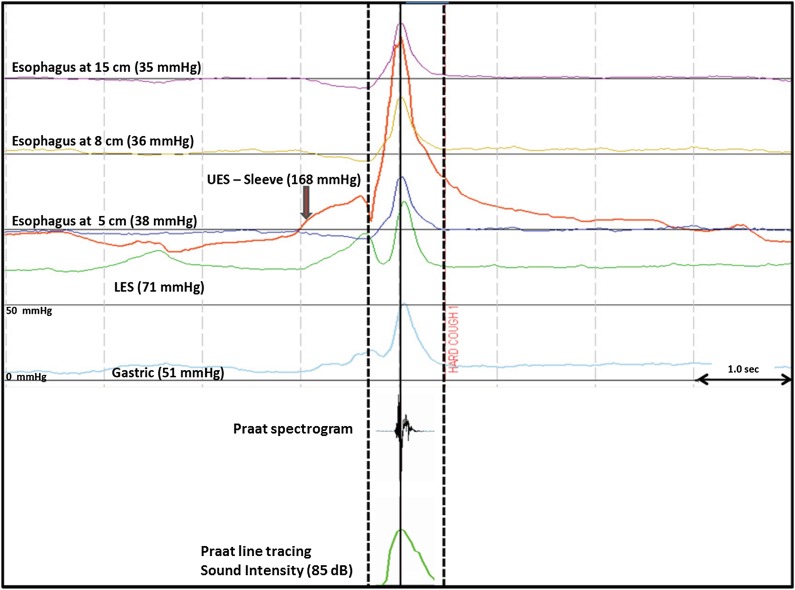
Figure 1.
Example of concurrent manometry line tracing during cough and Praat acoustic cough tracing. The solid-line frame represents the cough event. Intraluminal pressure measurements were noted at peak UES pressure (red line). Sound intensity was measured at the point of maximum intensity (Praat recordings). Each block on the y-axis has a pressure range of 0 to 50 mm Hg. LES = lower esophageal sphincter; UES = upper esophageal sphincter.

