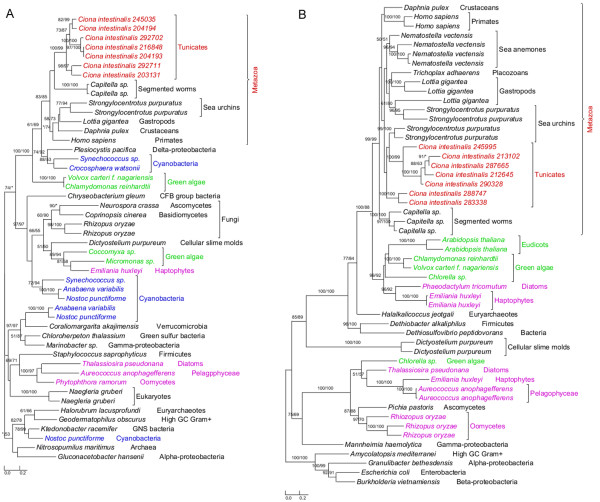
Figure 1.
Phylogeny of algal genes identified in Ciona . Numbers above branches show bootstrap values for maximum likelihood and distance analyses respectively. Asterisks indicate values lower than 50%. Other bootstrap values below 50% in both methods are not shown. Red: tunicates; green: Plantae; blue: cyanobacteria; pink: other plastid-containing eukaryotes. (A) Short-chain dehydrogenase/reductase family and (B) solute carrier family 23.

