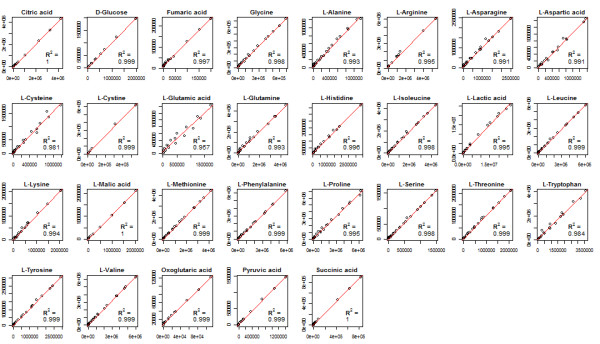
Figure 5.

EasyLCMS performance using calibration standards. Calibration standard areas obtained using Chemstation software (x-axis) compared with areas obtained using EasyLCMS (y-axis) in all the experiments performed to validate EasyLCMS (see Supplemental Material). Linear regressions (red lines) and regression coefficients (R2) are represented for the 29 metabolites analysed.
