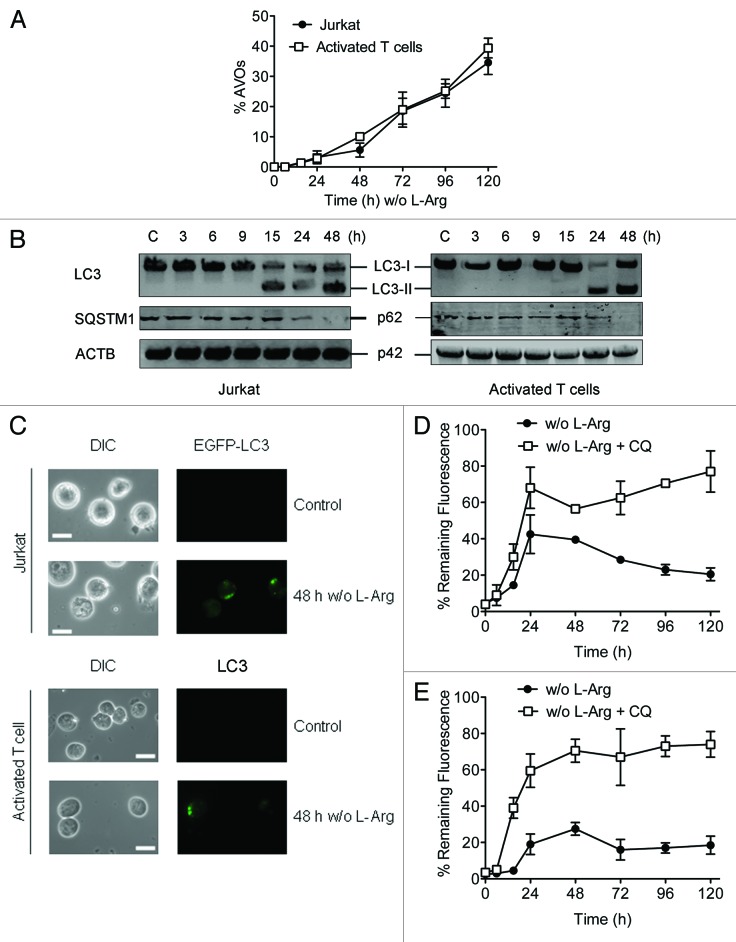
Figure 4. L-Arg depletion induces autophagy in Jurkat and peripheral blood mitogen-activated T cells. (A) The formation of acidic vesicular organelles (AVOs) was detected in acridine orange-stained cells by flow cytometry. The increment in red fluorescence represents formation of AVOs. (B) Cells were incubated with (C) or without L-Arg for the indicated times, and then conversion of LC3-I to LC3-II and degradation of SQSTM1 was determined by western blot using antibodies specific to LC3 and SQSTM1. ACTB was used as a loading control. (C) Immunofluorescence images of Jurkat-EGFP-LC3 cells and activated T cells incubated in L-Arg-containing (Control) and L-Arg-free medium for 48 h, and then activated T cells were immunostained for intracellular LC3. Scale bar: 10 µm. (D and E) Measurement of autophagic flux. Jurkat-EGFP-LC3 (D) and activated T cells (E) were incubated without L-Arg in the presence or absence of chloroquine (CQ) for the indicated times, washed briefly with 0.05% saponin in PBS, and analyzed for autophagosome-bound LC3 fluorescence. Activated T cells were immunostained with anti-LC3 antibody and a Cy2-conjugated secondary antibody, and then analyzed by flow cytometry for total fluorescence. Data are presented as a percentage of the total fluorescence intensity before saponin treatment (% remaining fluorescence). Data shown are means ± SD or representative of three experiments performed.

An official website of the United States government
Here's how you know
Official websites use .gov
A
.gov website belongs to an official
government organization in the United States.
Secure .gov websites use HTTPS
A lock (
) or https:// means you've safely
connected to the .gov website. Share sensitive
information only on official, secure websites.
