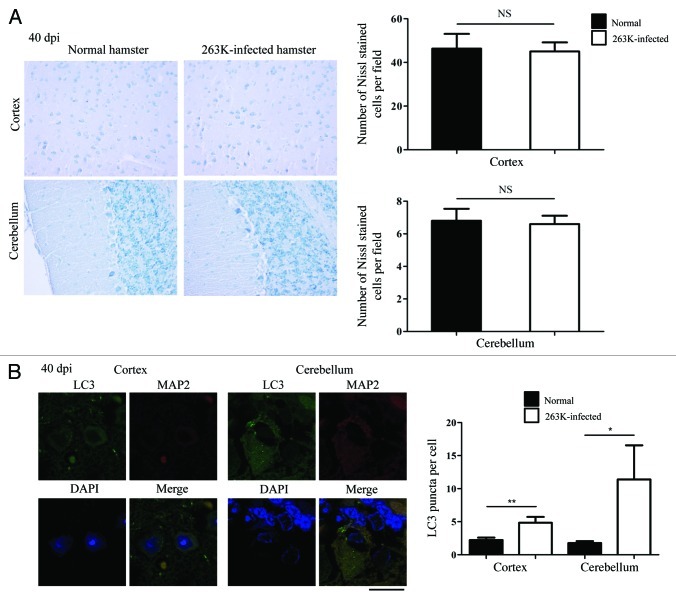
Figure 10. Autophagosome formation and neurodegeneration at 40th dpi. (A) Nissl staining for neurons in the cortex and the cerebellum regions of the scrapie agents 263K-infected hamsters at 40th dpi (×40). Left: Representative images for Nissl staining (×40). Right: Quantity of neurons in cortex and Purkinje cells. (B) Left: Double immunofluorescent staining for LC3 and MAP2 in the cortex region of brain sections of scrapie agents 263K-infected hamsters at 40th dpi. Scale bar: 20 μm. Right: The number of LC3 puncta per neuron in the cortex and the cerebellum regions at 40th dpi. Graphical data denote mean ± SD.

An official website of the United States government
Here's how you know
Official websites use .gov
A
.gov website belongs to an official
government organization in the United States.
Secure .gov websites use HTTPS
A lock (
) or https:// means you've safely
connected to the .gov website. Share sensitive
information only on official, secure websites.
