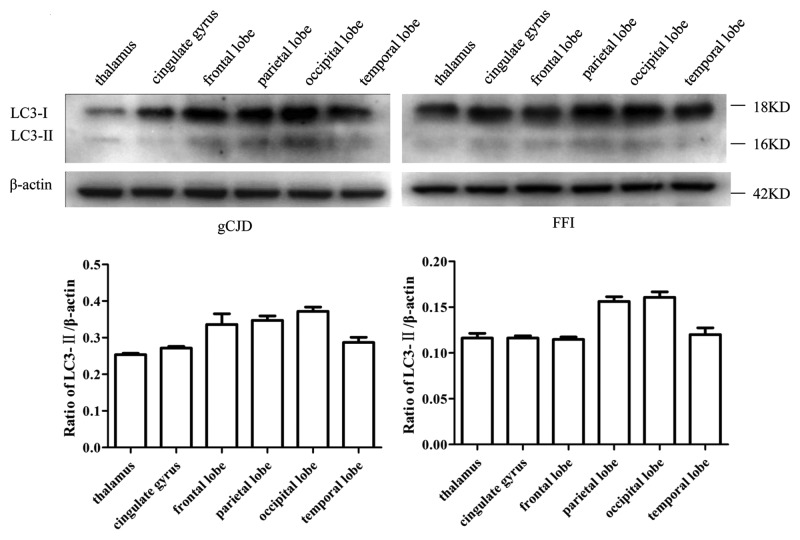
Figure 2. Analyses of the levels of LC3 in the brain tissues in human prion diseases. Western blots of six brain regions of a G114V gCJD patient (left panel) and a FFI patient (right panel). Various brain regions are indicated at the top. Molecular mass markers are indicated at the right. The densities of signals are determined by densitometry and shown relative to ACTB. p = 0.0006 (gCJD), p < 0.0001 (FFI). Graphical data denote mean ± SD.

An official website of the United States government
Here's how you know
Official websites use .gov
A
.gov website belongs to an official
government organization in the United States.
Secure .gov websites use HTTPS
A lock (
) or https:// means you've safely
connected to the .gov website. Share sensitive
information only on official, secure websites.
