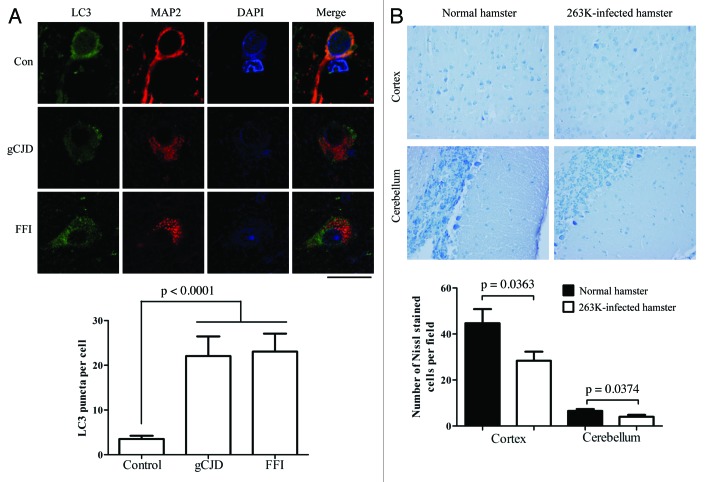
Figure 4. Autophagosomes localized in cytoplasm of neurons in brains of FFI and gCJD cases. (A) Top: Double immunofluorescence staining for LC3 and MAP2 in the parietal lobe region of brain sections of control and genetic prion diseases patients. The images of LC3 (green), MAP2 (red), DAPI (blue) and merge are indicated above. Scale bar: 20 μm. Bottom: The numbers of LC3 puncta per neuron in the parietal lobe regions of brain sections of control and genetic prion diseases patients. The images of LC3 (green), MAP2 (red), DAPI (blue) and merge are indicated above. (B) Top: Nissl staining for neurodegeneration in the cortex and the cerebellum regions of 263K-infected and normal hamsters (×40). Bottom: Quantity of neurons in cortex and Purkinje cells. Graphical data denote mean ± SD.

An official website of the United States government
Here's how you know
Official websites use .gov
A
.gov website belongs to an official
government organization in the United States.
Secure .gov websites use HTTPS
A lock (
) or https:// means you've safely
connected to the .gov website. Share sensitive
information only on official, secure websites.
