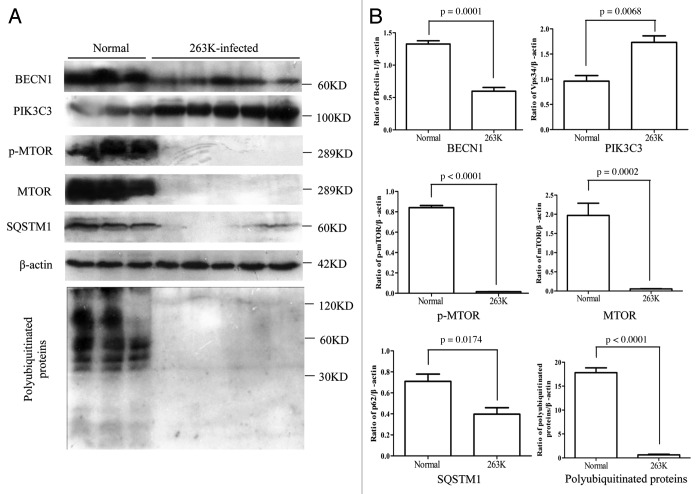
Figure 5. Comparative analyses of levels of BECN1, PIK3C3, p-MTOR, MTOR, SQSTM1 and polyubiquitinated proteins in the brains of 263K-infected hamsters at terminal stage. (A) Western blots of autophagic markers in brain homogenates of normal and scrapie agents 263K-inefcted hamsters. (B) Quantitative analyses of (A). Molecular mass markers are indicated at the right. The densities of signals are determined by densitometry and shown relative to β-actin. Graphical data denote mean ± SD.

An official website of the United States government
Here's how you know
Official websites use .gov
A
.gov website belongs to an official
government organization in the United States.
Secure .gov websites use HTTPS
A lock (
) or https:// means you've safely
connected to the .gov website. Share sensitive
information only on official, secure websites.
