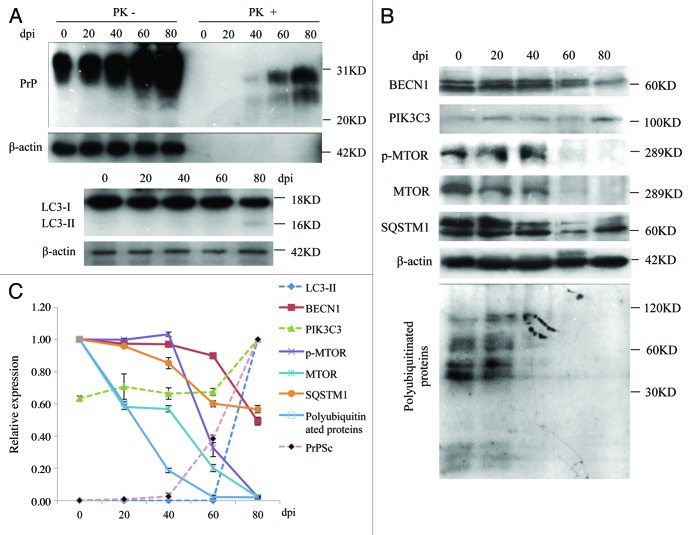
Figure 9. Dynamic assays of autophagic system and PrPSc in the brain tissues of 263K-infected hamsters during incubation period. (A) Western blots for PrPSc and LC3. (B) Western blots for BECN1, PIK3C3, p-MTOR, MTOR, SQSTM1 and polyubiquitinated proteins. The same amounts of individual brain homogenate were loaded and analyzed by 6% or 15% SDS-PAGE. The data of dpi are showed at the top. β-actin was used as an internal control. Molecular mass markers are indicated at the right. (C) Quantitative analysis of each gray numerical value of PrPSc, LC3-II, BECN1, PIK3C3, p-MTOR, MTOR, SQSTM1 and polyubiquitinated proteins vs that of individual β-actin. The relative expressing data of each marker are normalized to that of 0th dpi (Beclin-1, p-MTOR, MTOR, SQSTM1 and polyubiquitinated proteins) or that of 80th dpi (PrPSc, LC3-II and PIK3C3). Graphical data denote mean ± SD.

An official website of the United States government
Here's how you know
Official websites use .gov
A
.gov website belongs to an official
government organization in the United States.
Secure .gov websites use HTTPS
A lock (
) or https:// means you've safely
connected to the .gov website. Share sensitive
information only on official, secure websites.
