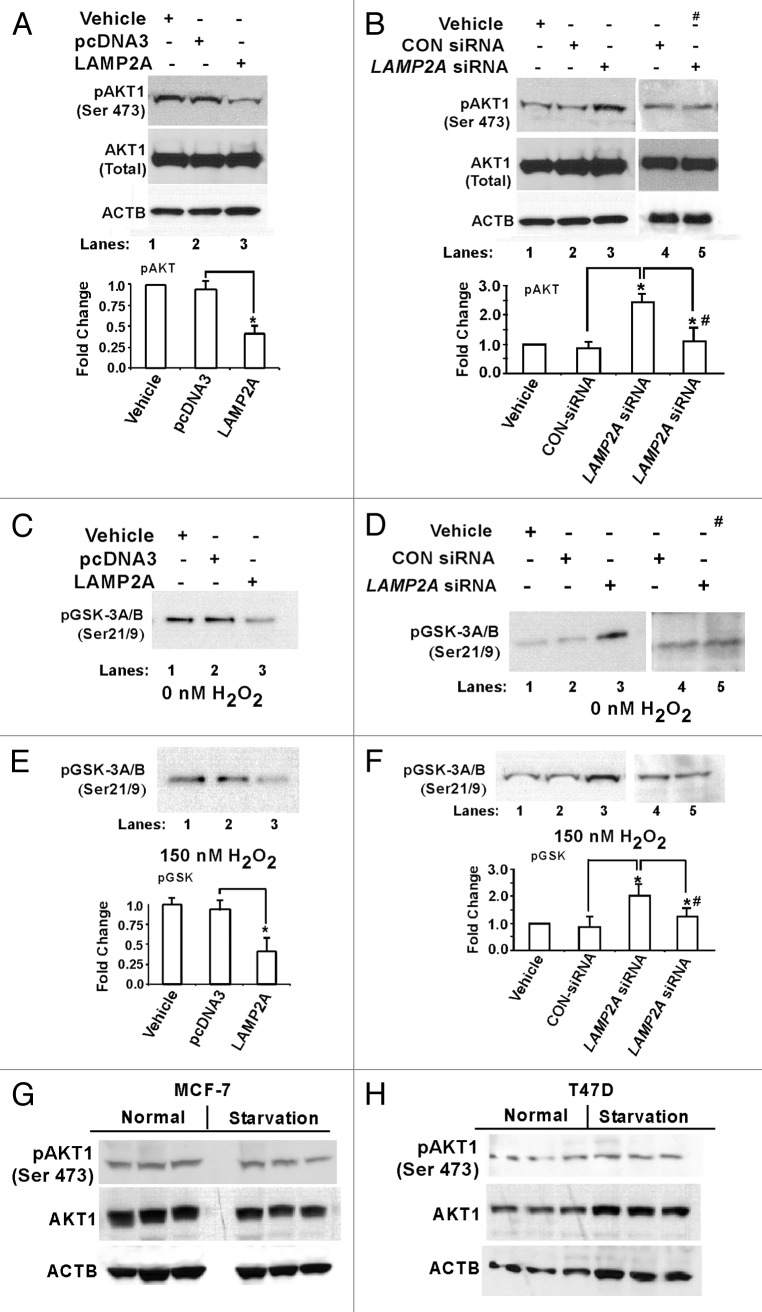
Figure 6. Knockdown of LAMP2A triggers AKT1 phosphorylation at Ser473. Proliferating T47D cells were either transfected with LAMP2A, or empty pcDNA3 vector for 48 h (A, C and E) and with LAMP2A siRNA or control siRNA for 72 h (B, D and F). (A and B) showing western blots analysis of total AKT1 and phospho AKT1 (Ser 473). (C and D) demonstrate AKT1 kinase activity using AKT1 substrate GSK3 fusion protein as a measure of AKT1 activation. (E and F) demonstrate the AKT1 substrate assay under oxidative stress condition rendered by 150 nM H2O2. Densitometric analyses from (E and F) are given under each panel. Data are mean ± SEMs, and significant changes are indicated by an asterisk (*p < 0.05 ANOVA; Tukey test). “#” represents the sample lanes that were treated with 1 μM Wortmannin. (G and H) Starvation does not promote AKT1 phosphorylation. Both MCF-7 and T47D cells were starved as described under methods and the cells were harvested after 48 h followed by SDS PAGE, and immunoblotted with indicated antibodies.

An official website of the United States government
Here's how you know
Official websites use .gov
A
.gov website belongs to an official
government organization in the United States.
Secure .gov websites use HTTPS
A lock (
) or https:// means you've safely
connected to the .gov website. Share sensitive
information only on official, secure websites.
