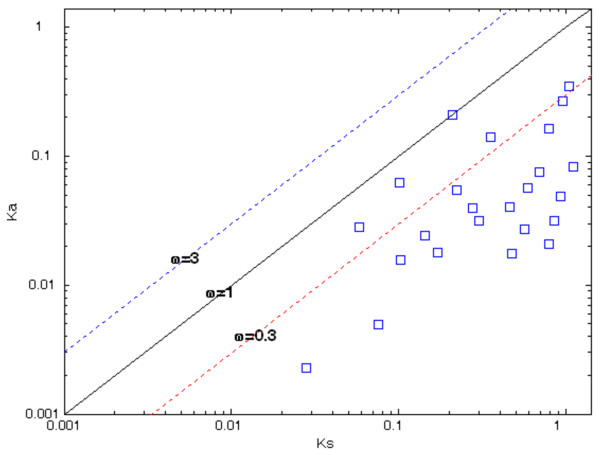
Figure 3.
Pattern of selection on 24 in-paralogs using γ-MYN method. The graph and axes are shown on a logarithmic scale. The diagonal lines from bottom to top represent ω = 3, ω = 1, and ω = 0.3 to provide a visual measure for the levels of selection operating on the gene pairs. The selective constraint was calculated on only the selected 24 in-paralogs, which exhibit Ks values < 1.1. The majority of the in-paralogs lie on or under the line of ω = 0.3 indicating that they are under purifying or negative selection.

