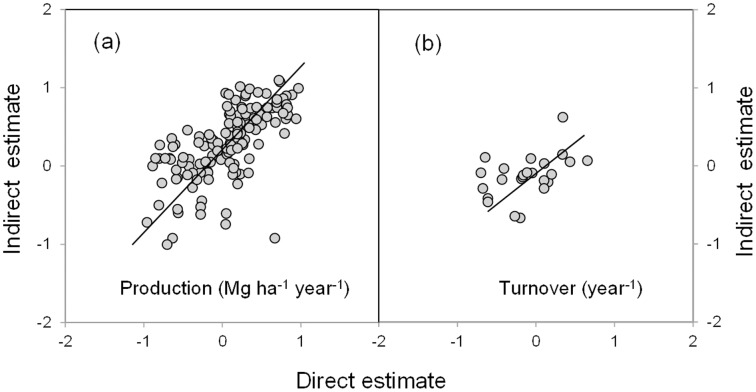
Figure 2. Relationships of direct estimates to indirect estimates.
(a) fine root production and (b) turnover rates. The values of fine root production (Mg ha−1 year−1) and turnover rates (year−1) are log-transformed (base 10). The relationships are best described by linear regressions (production: log10 y = 0.253+0.632×log10 x, r 2 = 0.418, P<0.001; turnover rates: log10 y = 0.089+0.324×log10 x, r 2 = 0.207, P<0.05).

