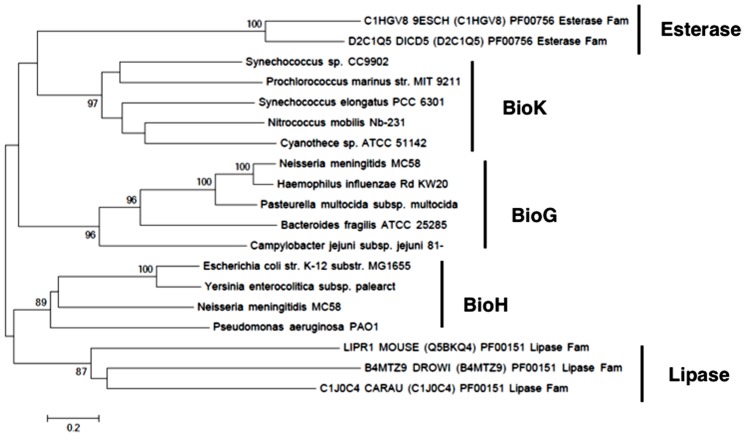
Figure 9. BioH, BioG and BioK are evolutionarily distinct.
The evolutionary relationship between sequences from several α,β-hydrolase families was inferred using the Mega5 [32]. Sequences from other families α,β-hydrolases were obtained from the Pfam database [22]. The bootstrap percentage values for 1000 replicates are shown next to the branches. The optimal tree is drawn to scale, with branch lengths in the same units as those of the evolutionary distances (the number of amino acid residue substitutions per site). The scale represents a 50% difference in compared residues per length. The analysis involved 23 amino acid sequences. All positions containing gaps and missing data were eliminated. The final dataset had a total of 148 positions. Bootstrap values lower than 80% are not shown.

