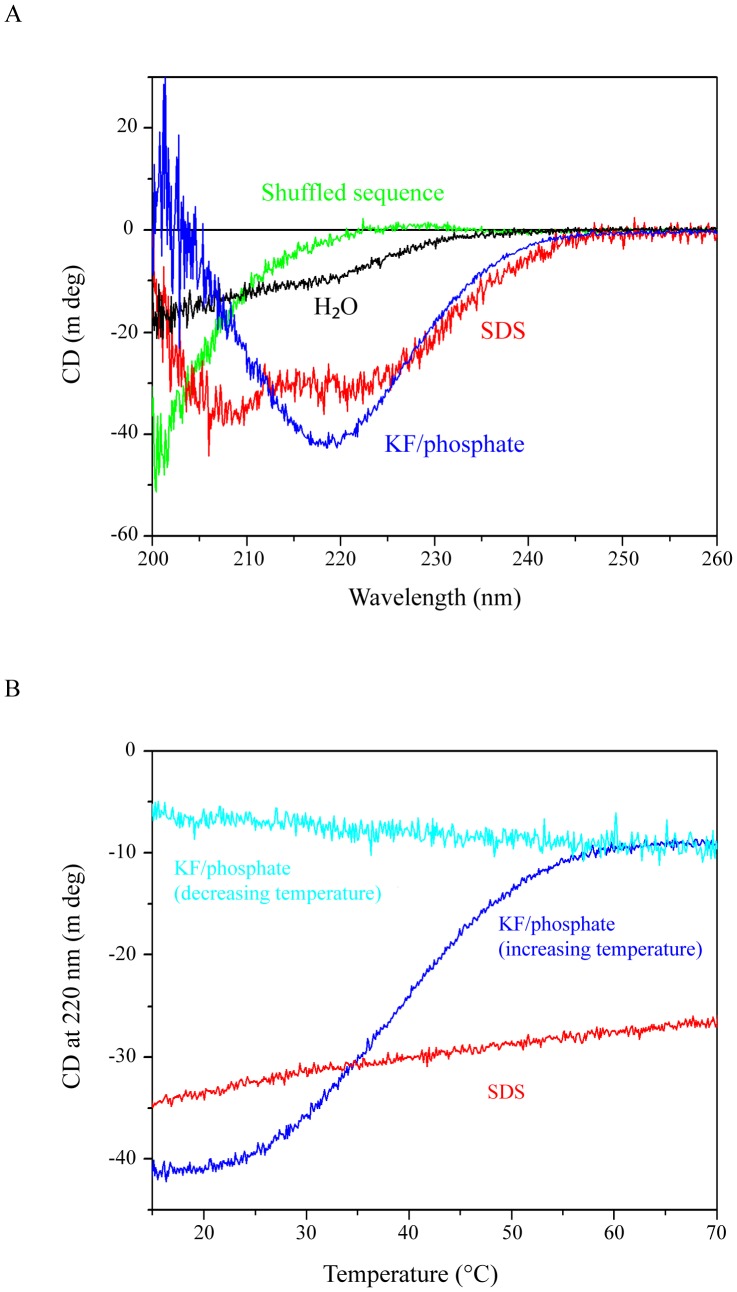
Figure 4. CD spectra of NFL-TBS.40-63 peptide.
(A): CD spectra of 20 µM biotinylated NFL-TBS.40-63 peptide were measured in pure water (black line), 2 mM SDS (red line) and KF/phosphate buffer (blue line). The spectrum of peptide with a shuffled sequence (green) is also shown. (B): Change in CD signal at 220 nm of 20 µM biotinylated NFL-TBS.40-63 in KF/phosphate buffer (blue line) and 2 mM SDS (red line) with increasing temperature was measured and is presented as a function of temperature. The change with decreasing temperature measured in KF/phosphate buffer (light blue line) is also shown.

