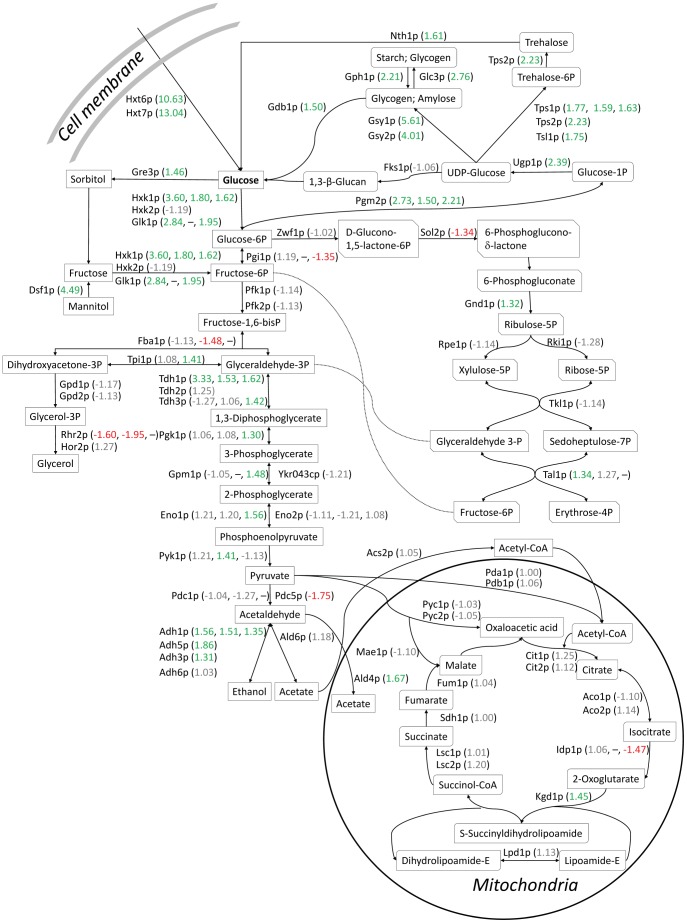
Figure 5. The proteomic response on the central carbon metabolism upon encapsulation of yeast.
The central carbon metabolism is presented with up-regulated proteins with fold changes (encapsulated cells compared to free cells) in green, down-regulated proteins with fold changes in red and unaffected proteins with the measured fold changes in grey. The first number represents the fold change obtained by n-LC-MS/MS. Where applicable, this is followed by the average fold change obtained from 2-D DIGE spots with unique significant protein hits, and the average fold change obtained from spots with significant hits for co-migrating proteins in 2-D DIGE.

