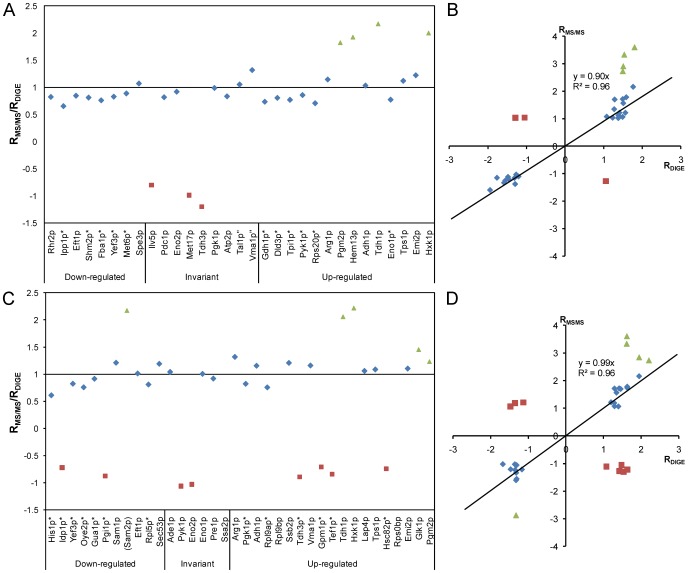
Figure 6. Correlation between the proteomic methods 2-D DIGE and nLC-MS/MS with TMT®.
Correlation between the average ratios of 31 proteins (with single significant hits in spots on the gel) (A and B) and 33 co-migrating proteins (with two or more significant hits per spot on the gel, giving uncertainties in the quantification of each individual protein in the spot) (C and D) proteins obtained by 2-D DIGE (RDIGE) and nLC-MS/MS (RMS/MS). A and C, the ratios obtained by nLC-MS/MS divided by the mean ratios obtained by 2-D DIGE, for single significant hit spots and spots with co-migrating proteins respectively. Triangles indicate extremely up-regulated proteins (fold change >2.5) as measured by the nLC-MS/MS approach and squares indicate proteins showing different sign of the fold change in the two approaches. The proteins were sorted by increasing fold change values obtained by the 2-D DIGE approach and divided into three groups, depending on the expression according to 2-D DIGE. Proteins marked with * had invariant expression in the nLC-MS/MS approach, and those marked with “were up-regulated. Proteins in parentheses (Sam2p) had extremely large RSD among the replicates in nLC-MS/MS and missing values indicate that the protein was not detected in the nLC-MS/MS approach (Ssa2p, Rpl9bp, Rps0bp). B and D, correlation plots of the ratios obtained by DIGE (x-axis) against the ratios obtained by nLC-MS/MS (y-axis), for unique (B) and co-migrating (D) protein spots, respectively. Extremely up- or down-regulated proteins (triangles) as well as the three and eight proteins showing different expression with the two methods (squares) were excluded from the calculation of the correlation.

